BSE Sensex Share Price Today and Live Chart - PE Ratio, PB, EPS, Dividend yield, ETFs, Performance, FnO
BSE Sensex Index
- ICICI Prudential BSE Sensex ETFSENSEXIETF857.02006.84 (0.80%)
- UTI BSE Sensex ETFSENSEXBETA819.9400-2.06 (-0.25%)
- HDFC BSE Sensex ETFHDFCSENSEX84.51000.29 (0.34%)
BSE Sensex Performance: BSE Sensex Index Today, Week, Month, Year Change
BSE Sensex index today and over the week, month and year


- < -5%
- -2 to -5%
- 0 to -2%
- 0 to 2%
- 2 to 5%
- > 5%
Technical Analysis
BSE Sensex EMA & SMA
| 5 Day | 73933.4 |
|---|---|
| 10 Day | 73709.0 |
| 12 Day | 73658 |
| 20 Day | 73632.9 |
| 26 Day | 73740.5 |
|---|---|
| 50 Day | 74389.1 |
| 100 Day | 75451.1 |
| 200 Day | 76923.8 |
BSE Sensex Resistance and Support
| First Resistance | 74774.1 |
|---|---|
| Second Resistance | 75088.6 |
| Third Resistance | 75434.6 |
| First Support | 74113.5 |
|---|---|
| Second Support | 73767.5 |
| Third Support | 73453.0 |
| Day RSI | 55.3 |
|---|---|
| Day MACD | -82.4 |
| Day MFI | - |
| Day MACD Signal Line | -305.8 |
BSE Sensex Price Change Analysis
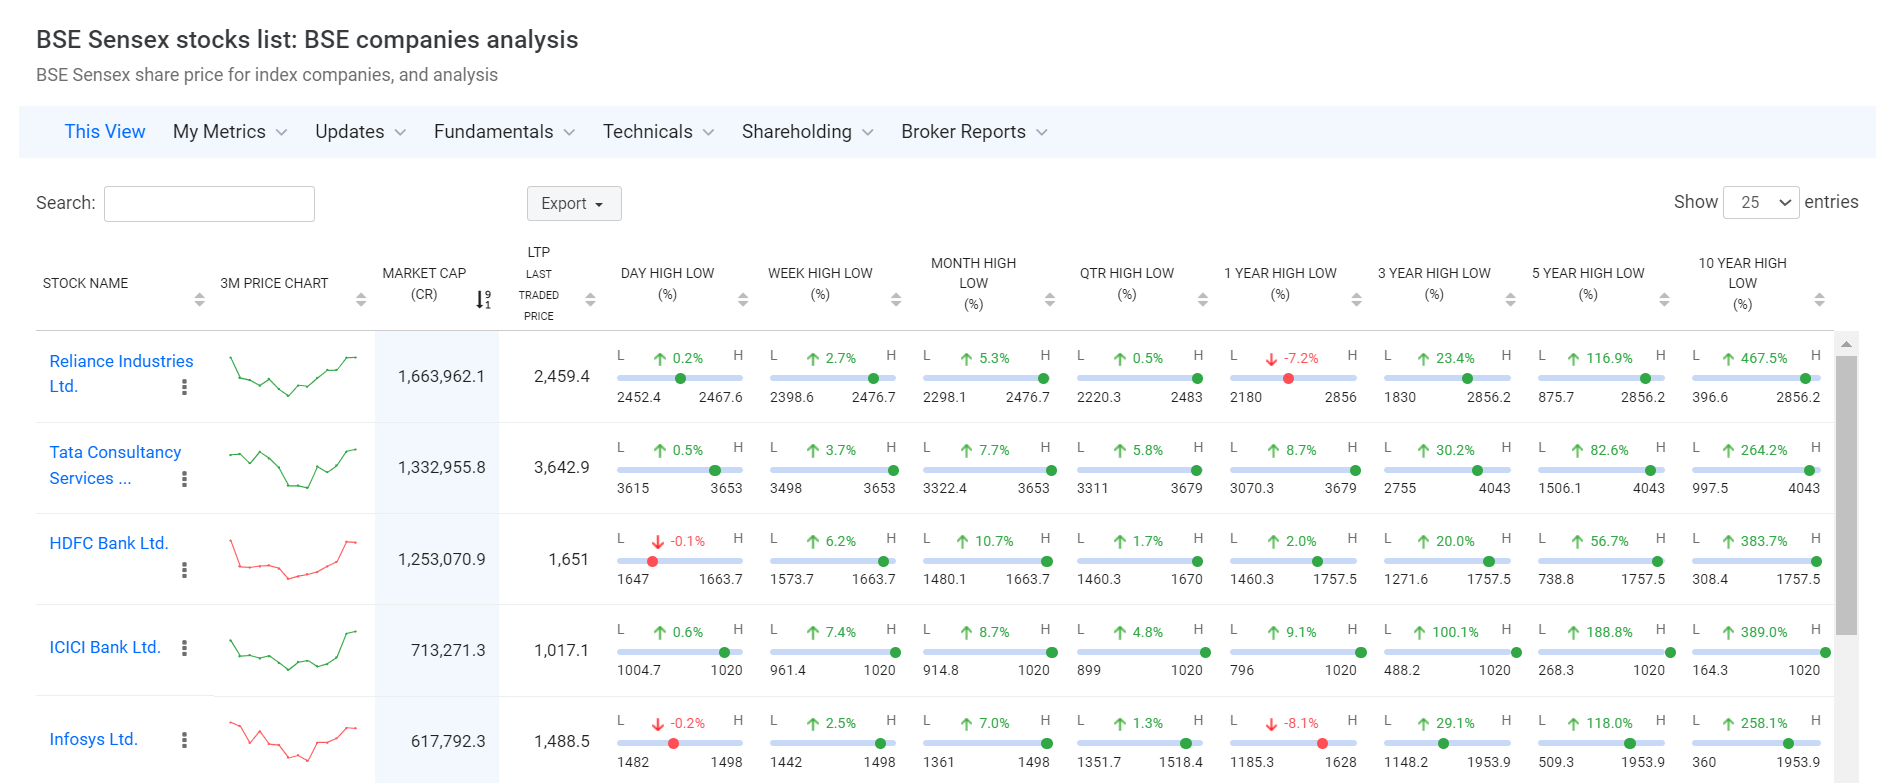
BSE Sensex stocks list: BSE Sensex companies analysis
BSE Sensex share price for index companies, and analysis
| Stock Name | 3M Price Chart | Market Cap | LTP Last Traded Price | Day High Low (%) | Week High Low (%) | Month High Low (%) | Qtr High Low (%) | 1 Year High Low (%) | 3 Year High Low (%) | 5 Year High Low (%) | 10 Year High Low (%) |
|---|---|---|---|---|---|---|---|---|---|---|---|
| Reliance Industries | 1,576,405.4 | 1,164.9 | L -0.2%H 1152.51174.6 | L -2.1%H 1152.51204.5 | L -1.5%H 1152.21234.3 | L -9.9%H 1152.21337 | L -21.7%H 1152.21611.8 | L 0.7%H 1114.91611.8 | L -8.1%H 10901611.8 | L 347.5%H 230.31611.8 | |
| Bharti Airtel | 1,202,685.9 | 1,973.7 | L 0.1%H 19581985 | L 4.3%H 1874.51985 | L 11.4%H 1726.31985 | L 0.9%H 1726.32031 | L -4.5%H 1726.32174.5 | L 113.1%H 895.52174.5 | L 188.0%H 628.82174.5 | L 519.3%H 276.92174.5 | |
| HDFC Bank | 1,068,833.5 | 692.8 | L 1.4%H 680.9695.5 | LH 669.2695.5 | L -4.1%H 669.2734.9 | L -8.1%H 669.2757.6 | L -30.6%H 669.21017.5 | L -6.7%H 669.21020.5 | L -12.5%H 635.81020.5 | L 121.1%H 289.51020.5 | |
| ICICI Bank | 1,003,900.9 | 1,398 | L 0.8%H 1383.31404.9 | L 0.3%H 1361.41404.9 | L 8.2%H 1295.31411.8 | L -2.5%H 12911460 | L 2.6%H 1187.61480 | L 51.2%H 909.31500 | L 74.3%H 642.21500 | L 455.1%H 222.71500 | |
| TCS | 905,462.6 | 2,502.6 | L 1.0%H 2494.22527.7 | L -1.1%H 2408.22549.7 | L 23.1%H 2045.12625 | L 2.9%H 2032.42625 | L -17.6%H 1976.83350 | L -25.9%H 1976.84592.3 | L -26.3%H 1976.84592.3 | L 109.3%H 1026.04592.3 | |
| SBI | 887,847.0 | 961.9 | L -1.0%H 959.6971.9 | L 0.3%H 943.4971.9 | L -0.3%H 937.5983.8 | L -6.2%H 937.51124.5 | L 2.9%H 930.31234.7 | L 70.2%H 555.21234.7 | L 91.5%H 4251234.7 | L 273.4%H 149.51234.7 | |
| Bajaj Finance | 584,679.4 | 939.1 | L 0.0%H 931.2952.5 | L 1.1%H 899.2952.5 | L -3.6%H 899.2995.8 | L -10.9%H 899.21176.4 | L -10.8%H 787.91176.4 | L 25.2%H 618.81176.4 | L 26.9%H 5221176.4 | L 769.2%H 76.11176.4 | |
| L&T | 544,733.6 | 3,871.7 | L 0.9%H 3806.23872.7 | L 6.2%H 3615.13894 | L 3.3%H 3592.93894 | L -1.7%H 3592.94125.3 | L -2.9%H 3288.14440 | L 32.3%H 2871.14440 | L 119.2%H 1456.44440 | L 293.7%H 6614440 | |
| Infosys | 480,907.6 | 1,185 | L 3.4%H 1147.91185 | L 2.7%H 1103.41185 | L 16.7%H 990.11197.8 | L 2.6%H 980.41197.8 | L -20.7%H 980.41728 | L -13.9%H 980.42006.5 | L -28.9%H 980.42006.5 | L 136.5%H 4302006.5 | |
| Kotak Mahindra Bank | 459,194.2 | 461.6 | L 0.6%H 457.1462.9 | L 7.2%H 437.6462.9 | L 13.7%H 406.0462.9 | L 18.5%H 386.5462.9 | L 8.0%H 345.5462.9 | L 34.4%H 308.8462.9 | L 13.6%H 308.8462.9 | L 181.6%H 138.5462.9 | |
| Hindustan Unilever | 438,104.8 | 1,864.6 | L 0.3%H 1840.41865.5 | L 2.8%H 1758.21878.6 | L 0.0%H 1758.21926.8 | L -11.5%H 1758.22138 | L -24.5%H 1758.22488 | L -24.8%H 1758.23035 | L -22.1%H 1758.23035 | L 122.2%H 782.03035 | |
| Sun Pharmaceutical | 426,529.8 | 1,777.7 | L 1.0%H 1766.21855 | L 1.7%H 1726.21855 | L -4.7%H 1719.11863.6 | L -11.2%H 1719.12046.9 | L 4.4%H 1583.72046.9 | L 59.4%H 1068.42046.9 | L 123.6%H 733.72046.9 | L 137.6%H 3122046.9 | |
| Adani Ports | 399,625.7 | 1,850 | L -1.2%H 1813.71871.6 | L 8.7%H 16881872 | L 1.5%H 1674.21872 | L 11.2%H 1593.11872 | L 26.9%H 12921891.1 | L 135.7%H 767.21891.1 | L 167.0%H 395.11891.1 | L 506.0%H 2031891.1 | |
| Titan Company | 393,866.3 | 4,436.5 | L 0.1%H 4391.34486 | L 3.2%H 4240.84486 | L -5.1%H 42094698 | L -8.5%H 42095186.7 | L 18.3%H 3667.35186.7 | L 42.4%H 29255186.7 | L 86.1%H 1825.15186.7 | L 1060.6%H 296.25186.7 | |
| HCL Technologies | 387,538.5 | 1,428.1 | L 1.7%H 14101452 | L 0.4%H 13641452 | L 16.9%H 1172.81467.5 | L 5.6%H 1172.81467.5 | L -7.9%H 10301780.1 | L 12.9%H 10302012.2 | L 24.9%H 877.42012.2 | L 272.0%H 3682012.2 | |
| Axis Bank | 378,983.4 | 1,217 | L -0.7%H 1209.21227.7 | L 0.0%H 12001229.2 | L 0.4%H 1196.91293.8 | L -1.0%H 11751300 | L -1.7%H 1150.31418.3 | L 23.0%H 933.51418.3 | L 64.0%H 618.31418.3 | L 149.5%H 2861418.3 | |
| Maruti Suzuki | 358,324.6 | 11,397 | L -0.3%H 1134211473 | L 1.5%H 1110211616 | L -4.0%H 1098512065 | L -19.7%H 1098514440 | L -29.7%H 1098517370 | L 9.6%H 9737.717370 | L 52.3%H 6536.617370 | L 93.3%H 4001.117370 | |
| Mahindra & Mahindra | 353,199.5 | 2,840.3 | L -1.7%H 28392905.4 | L -0.7%H 2816.42912.9 | L -3.7%H 2744.32986 | L -13.5%H 2744.33534.6 | L -18.9%H 2744.33839.9 | L 89.6%H 14503839.9 | L 221.2%H 671.23839.9 | L 331.3%H 245.43839.9 | |
| ITC | 332,847.6 | 265.6 | L 0.2%H 262.7267.9 | L 3.0%H 252.8267.9 | L 0.2%H 252.8269.8 | L -6.8%H 252.8292.6 | L -36.6%H 252.8426.4 | L -38.3%H 252.8528.5 | L 19.0%H 207528.5 | L 9.9%H 134.6528.5 | |
| Eternal | 331,634.3 | 343.7 | L 1.7%H 335.2346.5 | L 8.3%H 313.7346.5 | L 4.8%H 301.8346.5 | L 10.6%H 300.1346.5 | L 4.3%H 212.6346.5 | L 219.1%H 103.3368.5 | L 161.2%H 40.6368.5 | L 352.2%H 40.6368.5 | |
| UltraTech Cement | 325,473.2 | 11,045 | L -1.2%H 1100411154 | L -0.1%H 1092811211 | L 2.0%H 1042611219 | L -6.8%H 1042612239 | L -8.4%H 1032513110 | L 31.5%H 8351.113110 | L 44.6%H 5157.113110 | L 178.6%H 291013110 | |
| NTPC | 306,657.1 | 316.3 | L 1.9%H 308.2318 | L 6.1%H 294.1318 | L -2.2%H 292.1324.3 | L -8.3%H 292.1350.9 | L -8.4%H 292.1414.4 | L 34.8%H 232.1448.5 | L 138.4%H 119.1448.5 | L 151.3%H 73.2448.5 | |
| Bharat Electronics | 270,388.7 | 369.9 | L 0.0%H 363.5371.2 | L 2.2%H 356.2374.4 | L -4.6%H 354.6391 | L -3.9%H 354.6416.4 | L -9.8%H 354.6473.5 | L 180.3%H 130.8473.5 | L 436.5%H 62.3473.5 | L 911.5%H 18.7473.5 | |
| Bajaj Finserv | 266,907.7 | 1,667.6 | L 0.0%H 16581680 | L 0.8%H 1624.81680.5 | L -4.3%H 1624.81760.9 | L -12.7%H 1624.82118.5 | L -21.1%H 15972128.9 | L 6.8%H 1419.12195 | L -6.4%H 1072.72195 | L 388.1%H 2482195 | |
| Power Grid Corp | 246,466.0 | 265 | L 1.9%H 259.3267.3 | L 7.1%H 244.6267.3 | L 1.3%H 242.3267.3 | L -7.3%H 242.3294.1 | L -9.1%H 242.3325.0 | L 31.9%H 200.5366.3 | L 90.9%H 135.2366.3 | L 169.1%H 68.7366.3 | |
| Asian Paints | 222,533.9 | 2,320 | L 0.8%H 2271.22348 | L 0.6%H 2217.12348 | L -3.9%H 2217.12430.5 | L -15.5%H 2217.12810 | L -8.1%H 21152985.7 | L -21.8%H 21153423.0 | L -25.2%H 21153590 | L 115.7%H 851.13590 | |
| Tata Steel | 209,224.0 | 167.6 | L -1.1%H 167.2168.7 | L 0.0%H 165.5172.5 | L -10.9%H 163.4189.6 | L -10.3%H 163.4193.7 | L -9.1%H 160.1224.4 | L 40.7%H 114.6224.4 | L 27.4%H 82.7224.4 | L 314.1%H 25.1224.4 | |
| InterGlobe Aviation | 188,600.5 | 4,877.6 | L 4.3%H 4635.44877.6 | L 7.2%H 4485.14877.6 | L 0.1%H 4464.45069.5 | L -6.8%H 4464.45508 | L -14.8%H 3895.25970 | L 95.5%H 2414.86232.5 | L 124.2%H 1511.86232.5 | L 419.8%H 6916232.5 | |
| Tech Mahindra | 175,535.1 | 1,790.8 | L 1.2%H 1773.61813.4 | L 0.0%H 1733.21813.4 | L 18.6%H 1442.51845 | L 7.3%H 1442.51845 | L 24.9%H 1304.11854 | L 58.9%H 1113.81854 | L 21.2%H 943.71854 | L 307.3%H 356.71854 | |
| Trent | 160,892.2 | 3,017.3 | L 5.4%H 29803060 | L 10.6%H 2690.33060 | L 14.5%H 2545.83060 | L 0.6%H 2545.83244.5 | L -4.6%H 2183.73399.7 | L 113.5%H 1412.75563.3 | L 351.2%H 647.15563.3 | L 2115.3%H 116.75563.3 |
BSE Sensex FAQ
The BSE Sensex Index is a benchmark stock market index on India's Bombay Stock Exchange (BSE), representing 30 of the largest companies in terms of market capitalization listed on the BSE. This index is utilized to assess the performance of the Indian equity market and is considered a key indicator by investors and analysts.
The BSE selects the stock list for the BSE Sensex. This selection is based on several factors including market capitalization, trading frequency, high liquidity, industry representation, and average daily turnover.
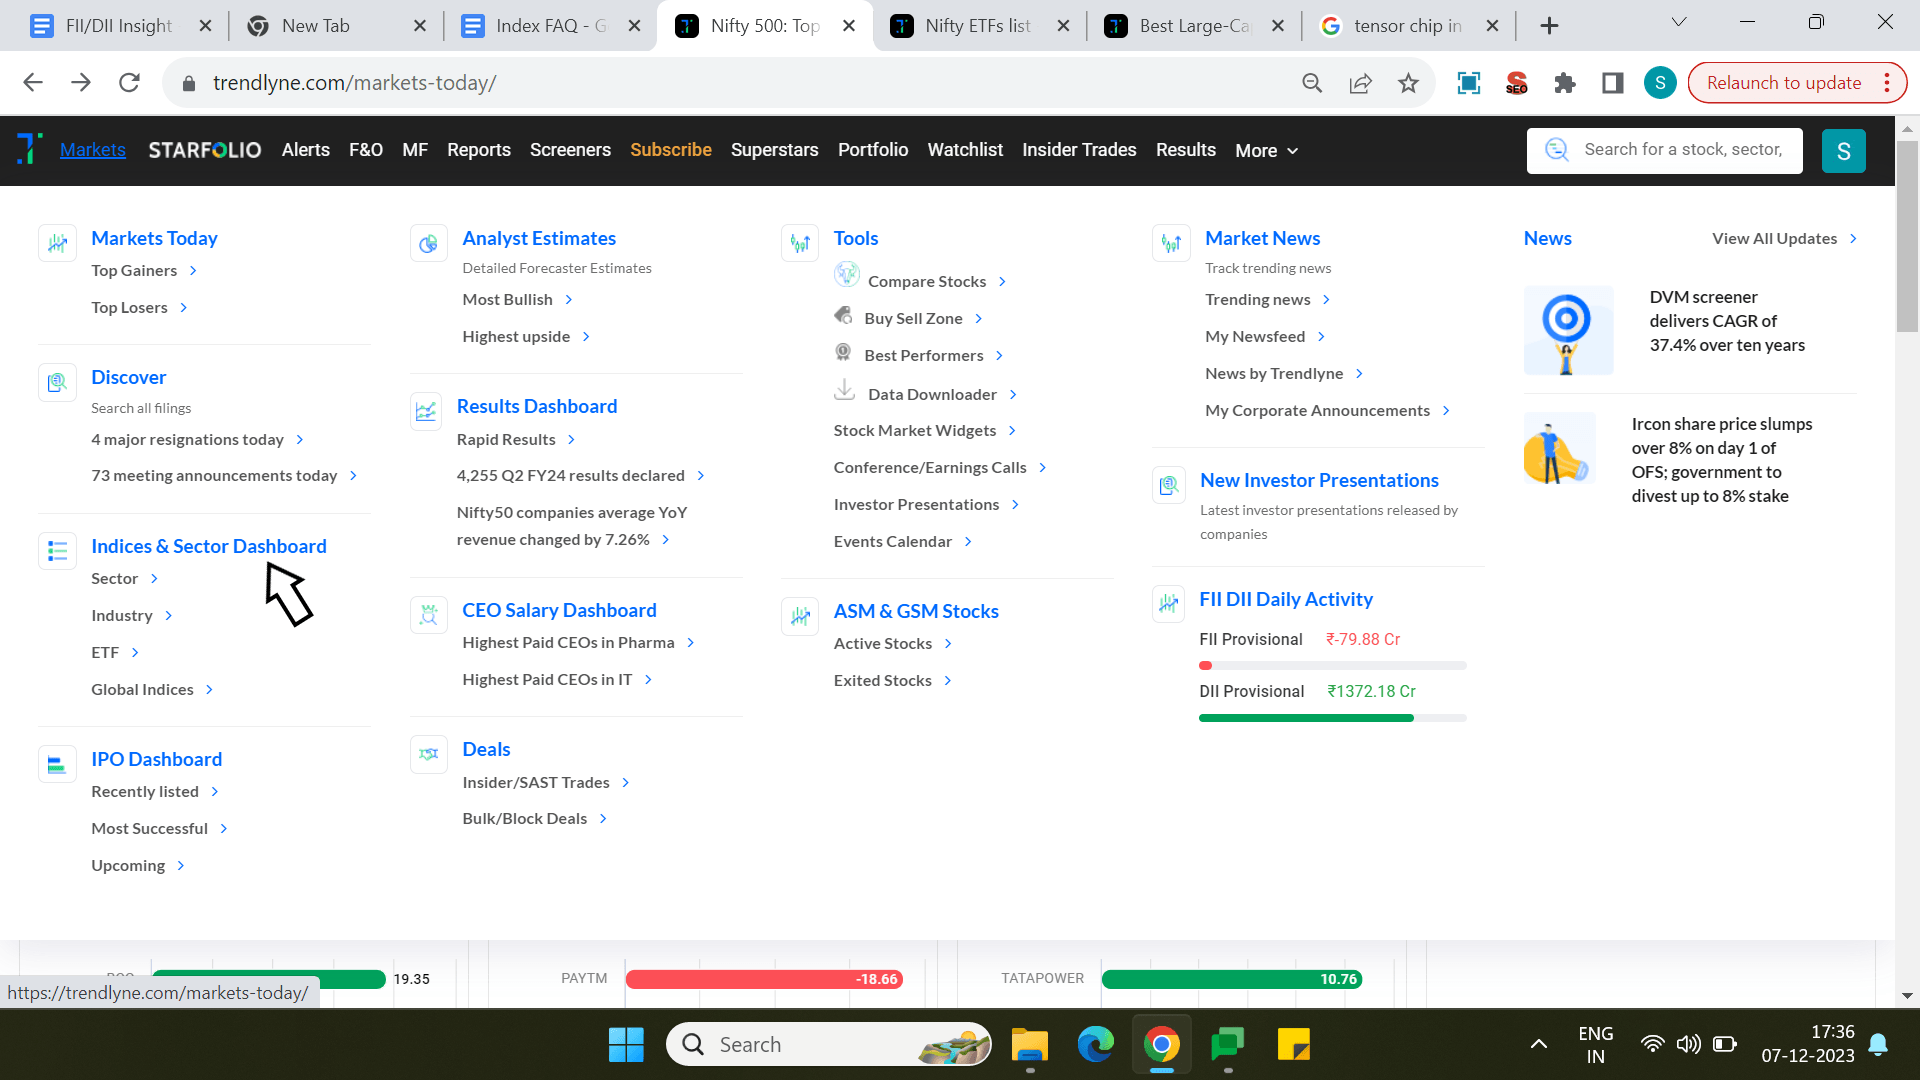
The index page can be accessed from the markets page. Here you will find both the Nifty 50 and the Sensex indices available as links.
It can also be accessed by hovering over the markets icon in the top left corner, and then clicking the indices and sector dashboard as pointed out by the arrow mark.
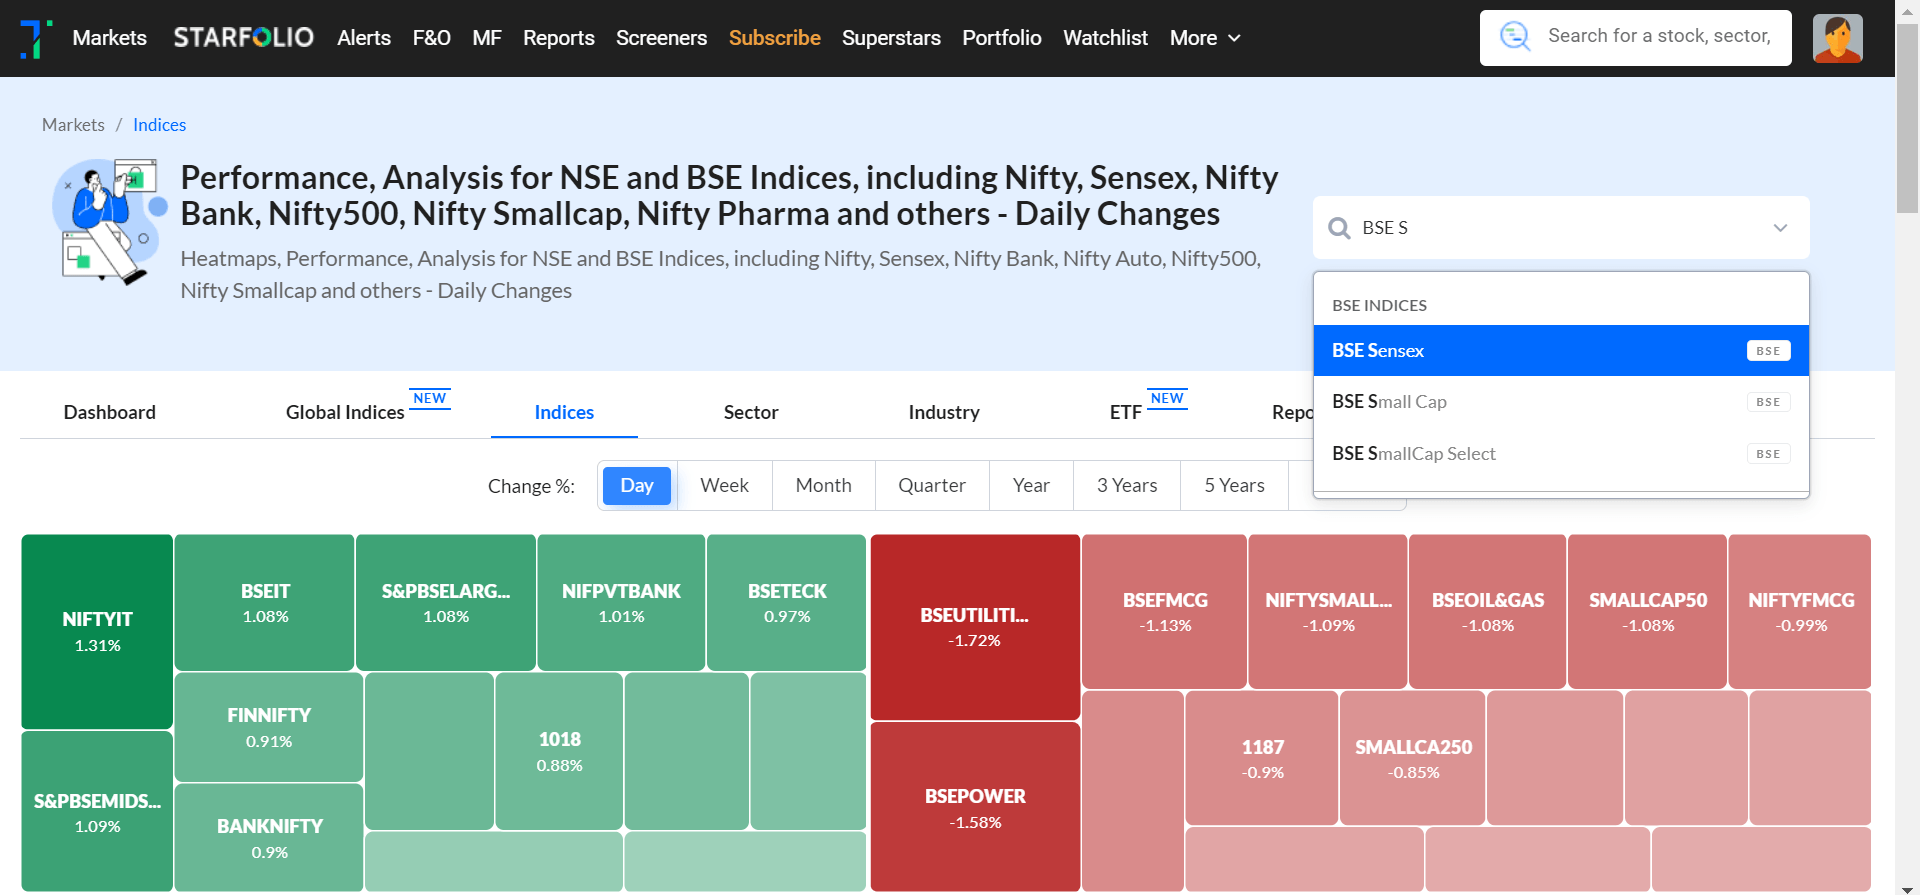
In the Indices and Sector Dashboard, type “BSE Sensex” in the search bar, which will take you to the BSE Sensex overview page.
BSE Sensex undergoes rebalancing semi-annually, usually in June and December. This process involves adjusting the index constituents based on criteria like market capitalization, liquidity, and sector representation. This ensures that the BSE Sensex remains a dependable indicator of the Indian stock market.
You can invest in the BSE Sensex Index through index funds, ETFs, or by buying shares of its constituent companies.
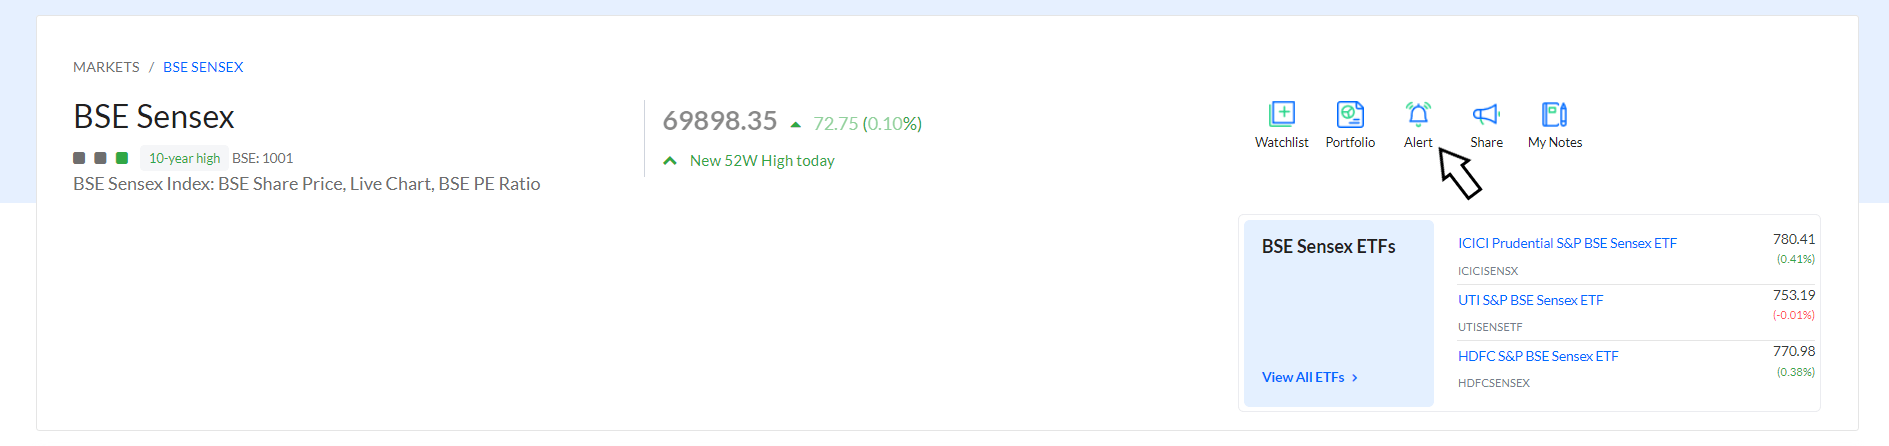
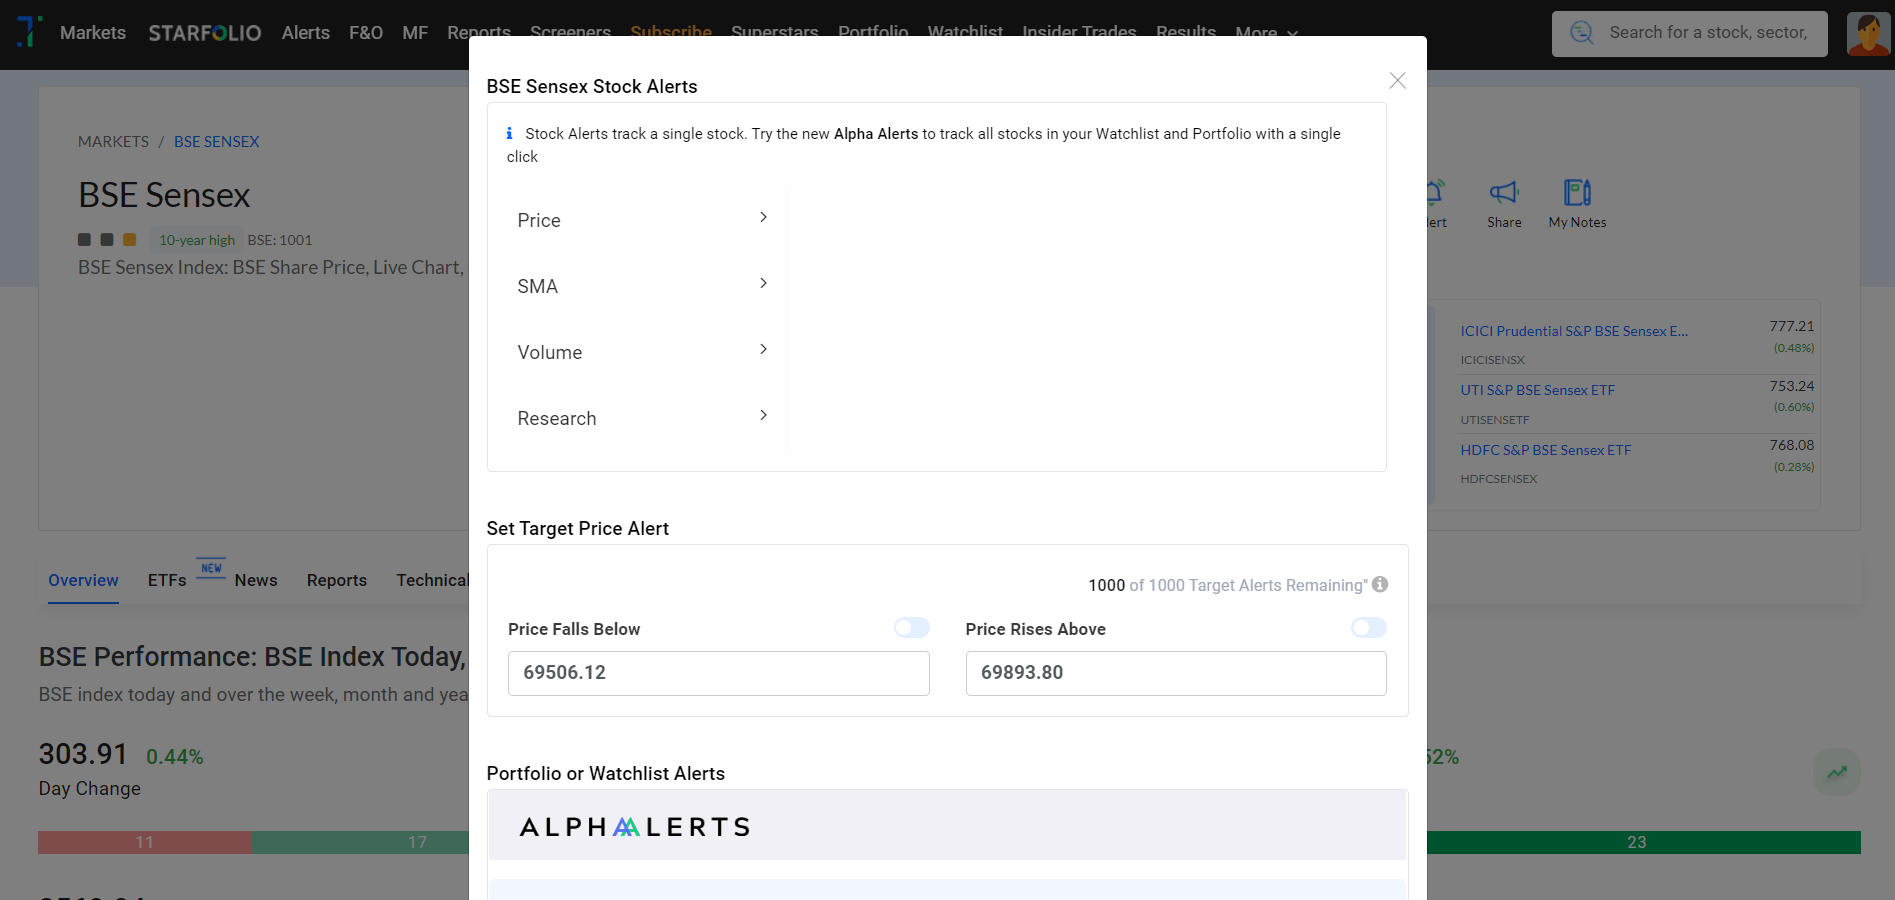
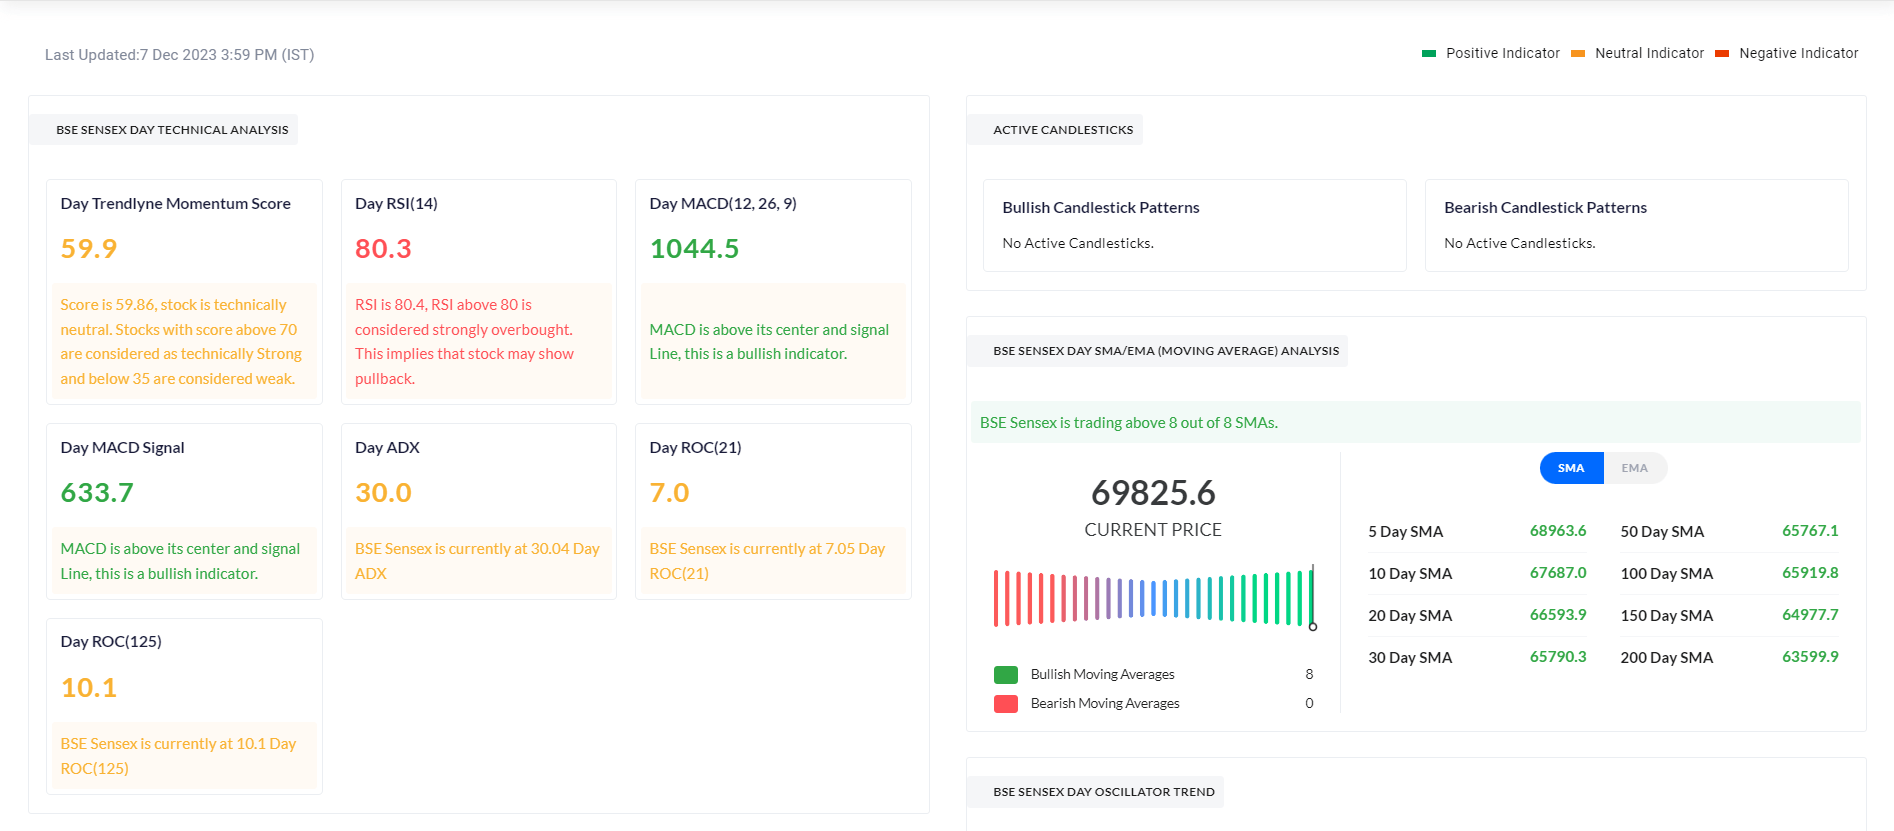
You can find the analysis of BSE Sensex technicals under the Technicals section on the BSE Sensex page, with the MACD, SMAs, RSI, ADX, etc.