
- POSITIVE
Quarterly Revenue Pidilite Industries Sep-2026 Quarterly Revenue is Rs 4,124 Cr which is growth of 22.9% YoY.
- POSITIVE
Quarterly Net Profit Pidilite Industries Sep-2026 Quarterly Net Profit is Rs 647 Cr which is growth of 10.4% YoY.
NSE: PIDILITIND | BSE: 500331
Pidilite Industries Live Share Price Today, Share Analysis and Chart
aboutPidilite Industries Ltd. is a leading manufacturer of consumer and specialty chemicals in India. The company holds a dominant market position in the adhesives and sealants category, underpinned by its flagship brand, Fevicol, which has become syn... Read More
1461.6039.60(2.78%)
1.1M
NSE+BSE Volume
NSE 30 Oct, 2026 3:31 PM (IST)
Expensive PerformerThese stocks are strong in quality but with mid-range technicals. Their valuations are expensiveView SimilarEmbed DVM
Please subscribe to view forecaster data
Pidilite Industries Stock Price Analysis
Day Price Range2.8% 1 Day return | 1461.6 (LTP) 1,400.21,461.6 LowHigh |
|---|---|
Week Price Range-1.8% 1 Week return | 1461.6 (LTP) 1,342.31,484.3 LowHigh |
Month Price Range0.0% 1 Month return | 1461.6 (LTP) 1,342.31,524.6 LowHigh |
52 Week Price Range-1.7% 1 Year return | 1461.6 (LTP) 1,2591,707.5 LowHigh |
Pidilite Industries Forecaster - Analyst Share Price Target and Estimates
Revenue forecast
EPS forecast
CURRENT EPS
AVG. ESTIMATE
Consensus Recommendation
21 ANALYST Recommendations
BUY
Forecaster is a Premium Feature
You need to upgrade your subscription plan to access this feature
See what you get Forecaster
Competitors/Peers
Revenue Mix
Quarterly
Annual
Balance Sheet
Ratios
Cash Flow
Documents
Pidilite Industries quarterly results: revenue, profit, and P&L – 13 quarter history
Nested row level
Base Level
Reporting Type
Standalone
Cell Data
Actual
Table Settings
YoY & New to Old
Nested row level
Base Level
Export
| Indicator | Graph | Sep '26 | Jun '26 | Mar '26 | Dec '25 | Sep '25 | Jun '25 | Mar '25 | Dec '24 | Sep '24 | Jun '24 | Mar '24 | Dec '23 | Sep '23 |
|---|---|---|---|---|---|---|---|---|---|---|---|---|---|---|
| 4,124.3 | 4,343.7 | 3,343 | 3,503.8 | 3,355.8 | 3,563.5 | 2,966.9 | 3,153.6 | 3,049.1 | 3,197.5 | 2,630.9 | 2,894.5 | 2,816.6 | ||
Operating Exp. | 3,183.4 | 3,128.7 | 2,519.2 | 2,596.5 | 2,480.5 | 2,591.1 | 2,267 | 2,350.1 | 2,246.2 | 2,374.6 | 2,061.4 | 2,126.2 | 2,137.6 | |
Operating Profit | 811.2 | 1,120.6 | 765.7 | 839.7 | 806.9 | 888.2 | 583.8 | 749 | 730.8 | 771.3 | 527.5 | 708.3 | 642.5 | |
Operating Profit Margin % | 20.31% | 26.37% | 23.31% | 24.44% | 24.54% | 25.53% | 20.48% | 24.17% | 24.55% | 24.52% | 20.38% | 24.99% | 23.11% | |
Depr. | 87.7 | 84.5 | 81.9 | 86.2 | 85.4 | 82.8 | 83.9 | 76.7 | 75.4 | 72.4 | 98.6 | 66.5 | 62.5 | |
Interest | 10.9 | 10.9 | 9.8 | 10.6 | 10.2 | 10.2 | 10.3 | 8.3 | 7.9 | 8.1 | 7.8 | 7.5 | 7.5 | |
Profit Before Tax | 842.2 | 1,119.5 | 732.2 | 803 | 779.8 | 879.4 | 585.5 | 718.5 | 719.6 | 742.4 | 470.3 | 694.3 | 609.1 | |
Tax | 195.2 | 289.7 | 184.8 | 201.8 | 193.9 | 229.6 | 139.7 | 184 | 177.6 | 190.8 | 116 | 171.5 | 154.3 | |
Net Profit | 647 | 829.9 | 547.4 | 601.2 | 585.9 | 649.8 | 445.8 | 534.5 | 542 | 551.6 | 354.3 | 522.9 | 454.8 | |
EPS Adj. latest | 6.4 | 8.2 | 5.4 | 5.9 | 5.8 | 6.4 | 4.4 | 5.3 | 5.3 | 5.4 | 3.5 | 5.1 | 4.5 | |
Net profit TTM | 2,625.5 | 2,564.4 | 2,384.3 | 2,282.7 | 2,216 | 2,172.1 | 2,073.8 | 1,982.4 | 1,970.7 | 1,883.5 | 1,799.5 | 1,735.8 | 1,509.3 | |
Basic EPS TTM | 25.8 | 25.2 | 23.4 | 22.4 | 21.8 | 42.7 | 40.8 | 39 | 38.8 | 37 | 35.4 | 34.1 | 29.7 | |
Earnings Transcripts | ||||||||||||||
AI Summary | ||||||||||||||
Results PDF | ||||||||||||||
Result Notes |
*All financials are in INR Cr and price data in INR
Add metric to table
Search...
Pidilite Industries Technical Analysis
Pidilite Industries EMA & SMA
Bearish-4
2 bullish, 6 bearish
Bullish2
Bearish6
| 5 Day | 1445.5 |
|---|---|
| 10 Day | 1457.5 |
| 12 Day | 1461.8 |
| 20 Day | 1477.7 |
| 26 Day | 1489.0 |
|---|---|
| 50 Day | 1520.7 |
| 100 Day | 1533.5 |
| 200 Day | 1520.3 |
Pidilite Industries Delivery And Volume
Daily Avg. Delivery Volume %
30 Oct, 202654.2%
Week50.1%
Month57.2%
Pidilite Industries Active Candlesticks
Closing Marubozu Uptrend
Legend
Positive IndicatorNeutral IndicatorNegative Indicator
Pidilite Industries Resistance and Support
1441.13
Pivot
| First Resistance | 1482.1 |
|---|---|
| Second Resistance | 1502.5 |
| Third Resistance | 1543.5 |
| First Support | 1420.7 |
|---|---|
| Second Support | 1379.7 |
| Third Support | 1359.3 |
| Day RSI | 44.5 |
|---|---|
| Day MACD | -27.2 |
| Day MFI | 32.8 |
| Day MACD Signal Line | -25.7 |
Pidilite Industries Beta
| 1 Month | 1.1 |
|---|---|
| 1 Year | 1.1 |
| 3 Month | 1.2 |
|---|---|
| 3 Year | 0.7 |
Pidilite Industries Price Change Analysis
↑0.0%
Over 1 Month
LowHigh
1342.31524.6
↓-10.3%
Over 3 Months
LowHigh
1342.31707.5
↑5.2%
Over 6 Months
LowHigh
1342.31707.5
↓-1.7%
Over 1 Year
LowHigh
12591707.5
Pidilite Industries Deals - Insider, Bulk, Block and SAST
| Client Name | Deal Type | Action | Date | Avg. Price | Quantity | Exchange |
|---|---|---|---|---|---|---|
| BALVANT K PAREKH FOUNDATION | Block | Sell | 15 May 2026 | 1460 | 200,000 | BSE |
| ICICI PRUDENTIAL MUTUAL FUND | Block | Purchase | 15 May 2026 | 1460 | 200,000 | BSE |
| MRUDULA SUSHILKUMAR PAREKH | Block | Sell | 19 Nov 2025 | 1490 | 170,000 | BSE |
| PIDICHEM PVT LTD | Block | Purchase | 19 Nov 2025 | 1490 | 170,000 | BSE |
| THE MTBJ LTD AS TRST FOR GOVRNMNT PENSION INVSTMNT FUND MTBJ400045828 | Block | Sell | 14 Jul 2025 | 3000.80 | 55,983 | BSE |
| THE MTBJ LTD AS TRST FOR GOVERNMENT PENSION INVESTMENT FUND MTBJ400045849 | Block | Purchase | 14 Jul 2025 | 3000.80 | 55,983 | BSE |
| PURVEE APURVA PAREKH | Block | Sell | 29 Oct 2024 | 3170 | 50,000 | BSE |
| APURVA NARENDRAKUMAR PAREKH | Block | Sell | 29 Oct 2024 | 3170 | 150,000 | BSE |
| PARKEM DYES & CHEMICALS PVT LTD | Block | Purchase | 29 Oct 2024 | 3170 | 150,000 | BSE |
| PARKEM DYES & CHEMICALS PVT LTD | Block | Purchase | 29 Oct 2024 | 3170 | 50,000 | BSE |
Pidilite Industries Corporate Actions
Pidilite Industries Dividend history and yield
Pidilite Industries dividend yields, including actual and adjusted, and dividend history, including announcement, record, and ex-dividend dates. Track Pidilite Industries dividend yield over time.
#Ex-Date | Dividend Amount | Dividend Type | Record Date | Instrument Type |
|---|---|---|---|---|
123 Jul 2026 | 11.5 | FINAL | 23 Jul 2026 | Equity Share |
213 Aug 2025 | 10 | SPECIAL | 13 Aug 2025 | Equity Share |
323 Jul 2025 | 20 | FINAL | 23 Jul 2025 | Equity Share |
424 Jul 2024 | 16 | FINAL | - | Equity Share |
527 Jul 2023 | 11 | FINAL | 27 Jul 2023 | Equity Share |
Pidilite Industries Bonus shares
Pidilite Industries bonus history along with announcement, record, ex-bonus dates, and bonus ratios.
#Ex-Date | Bonus Ratio | Record Date |
|---|---|---|
123 Sep 2025 | 1:1 | 23 Sep 2025 |
215 Mar 2010 | 1:1 | 17 Mar 2010 |
305 Jun 2000 | 1:1 | - |
Pidilite Industries Board Meetings
Pidilite Industries past and upcoming board meetings.
#Ex-Date | Purpose | Notes |
|---|---|---|
128 Oct 2026 | Quarterly Results | - |
204 Aug 2026 | Quarterly Results | - |
307 May 2026 | Audited Results & Final Dividend | - |
403 Feb 2026 | Quarterly Results | - |
530 Oct 2025 | Quarterly Results | - |
Pidilite Industries Stock Split
Pidilite Industries stock split details, including announcement, record, and ex-split dates, along with the split ratios
#Ex-Date | Old FV | New FV | Record Date |
|---|---|---|---|
120 Sep 2005 | 10 | 1 | 27 Sep 2005 |
Pidilite Industries Research Reports
Pidilite Industries research reports with share price targets, and buy/hold/sell recommendations from top brokers.
# Date | Broker Name | Target | Price When Recommended | Type | Upside | Change Since Recommendation | Links |
|---|---|---|---|---|---|---|---|
| 104 Aug 2026 | Motilal Oswal Target | 1700 | 1665 | Neutral | 2.1% | -12.22% | |
| 228 May 2026 | FundsIndia | 1761 | 1482.8 | Buy | 18.76% | -1.43% | |
| 325 May 2026 | Geojit BNP Paribas | 1647 | 1478.5 | Buy | 11.4% | -1.14% | |
| 403 Feb 2026 | Motilal Oswal Target | 1550 | 1460.3 | Neutral | 6.14% | 0.09% | |
| 503 Feb 2026 | Prabhudas Lilladhar Target | 1734 | 1460.3 | Buy | 18.74% | 0.09% |
Pidilite Industries Corporate Filings
Pidilite Industries BSE corporate filings and AGM, press releases, insider trading & SAST, results and corporate actions.
| Date | Announcement Title | Details | Links |
|---|---|---|---|
| 30 Oct 2026 | Pidilite Industries Ltd - 500331 - Announcement under Regulation 30 (LODR)-Newspaper Publication | Newspaper Publication - Financial Results | |
| 29 Oct 2026 | Pidilite Industries Ltd - 500331 - Audio Recording Q2FY27 Earnings Call | Audio recording of Q2FY27 Earnings Call | |
| 29 Oct 2026 | Pidilite Industries Results Earnings Call for Q2FY27 | Conference Call with Pidilite Industries Management and Analysts on Q2FY27 Performance and Outlook. Listen to the full earnings transcript. | |
| 29 Oct 2026 | Q2FY27 Quarterly Result Announced for Pidilite Industries Ltd. | Specialty Chemicals company Pidilite Industries announced Q2FY27 results Standalone Financial Highlights: Revenue from Operations: In Q2FY27, standalone revenue from operations stood at Rs 3,994.57 crore, registering a QoQ decrease of 6.00% compared to Rs 4,249.38 crore in Q1FY27, and a YoY increase of 21.51% compared to Rs 3,287.31 crore in Q2FY26. For H1FY27, standalone revenue from operations reached Rs 8,243.95 crore, up by 21.83% compared to Rs 6,766.61 crore in H1FY26. Total Income: Standalone total income was Rs 4,124.26 crore in Q2FY27, showing a QoQ decline of 5.05% against Rs 4,343.65 crore in Q1FY27, and a YoY increase of 22.90% from Rs 3,355.82 crore in Q2FY26. For H1FY27, standalone total income reached Rs 8,467.91 crore, a YoY growth of 22.38% against Rs 6,919.30 crore in H1FY26. Interest Earned: Interest earned is not reported as a separate line item on the face of the financial statements, but standalone interest income within investing cash flows was Rs 18.58 crore for H1FY27 compared to Rs 3.07 crore in H1FY26. Profit Before Tax (PBT): Standalone PBT stood at Rs 842.24 crore in Q2FY27, experiencing a QoQ decline of 24.77% from Rs 1,119.52 crore in Q1FY27, and a YoY increase of 8.01% from Rs 779.75 crore in Q2FY26. For H1FY27, standalone PBT was Rs 1,191.99 crore in the sequential comparison layout but reported cumulatively at Rs 1,961.76 crore, a YoY expansion of 18.24% against Rs 1,659.14 crore in H1FY26. Profit After Tax (PAT): Standalone PAT was Rs 647.00 crore in Q2FY27, declining QoQ by 22.04% compared to Rs 829.87 crore in Q1FY27, and expanding YoY by 10.43% against Rs 585.90 crore in Q2FY26. For H1FY27, standalone PAT reached Rs 1,476.87 crore, a YoY increase of 19.52% compared to Rs 1,235.70 crore in H1FY26. Earnings Per Share (EPS): Standalone basic EPS was Rs 6.36 in Q2FY27, falling QoQ by 21.96% compared to Rs 8.15 in Q1FY27, and rising YoY by 10.42% compared to Rs 5.76 in Q2FY26. For H1FY27, standalone basic EPS reached Rs 14.51, representing a YoY growth of 19.42% against Rs 12.15 in H1FY26. Consolidated Financial Highlights: Revenue from Operations: Consolidated revenue from operations stood at Rs 4,297.59 crore in Q2FY27, reflecting a QoQ contraction of 5.58% compared to Rs 4,551.55 crore in Q1FY27, and a YoY growth of 20.91% compared to Rs 3,554.44 crore in Q2FY26. For H1FY27, consolidated revenue from operations accumulated to Rs 8,849.14 crore, increasing YoY by 21.10% compared to Rs 7,307.54 crore in H1FY26. Total Income: Consolidated total income recorded Rs 4,362.18 crore in Q2FY27, dropping QoQ by 6.06% from Rs 4,643.55 crore in Q1FY27, and growing YoY by 21.02% from Rs 3,604.60 crore in Q2FY26. For H1FY27, consolidated total income registered Rs 9,005.73 crore, a YoY shift of 20.99% against Rs 7,443.41 crore in H1FY26. Interest Earned: Interest earned is not reported as a separate line item on the face of the consolidated income statement, but consolidated interest income within investing cash flows was Rs 16.93 crore for H1FY27 compared to Rs 5.56 crore in H1FY26. Profit Before Tax (PBT): Consolidated PBT was Rs 834.23 crore in Q2FY27, decreasing QoQ by 30.01% from Rs 1,191.99 crore in Q1FY27, and expanding YoY by 5.96% from Rs 787.31 crore in Q2FY26. For H1FY27, consolidated PBT achieved Rs 2,025.22 crore, scaling YoY by 18.87% compared to Rs 1,703.78 crore in H1FY26. Profit After Tax (PAT): Consolidated PAT stood at Rs 626.46 crore in Q2FY27, posting a QoQ decrease of 29.09% compared to Rs 883.51 crore in Q1FY27, and a YoY decrease of 8.49% against Rs 684.60 crore in Q2FY26. For H1FY27, consolidated PAT reached Rs 1,509.97 crore, showcasing a YoY rise of 19.58% compared to Rs 1,262.73 crore in H1FY26. Earnings Per Share (EPS): Consolidated basic EPS stood at Rs 6.04 in Q2FY27, decreasing QoQ by 29.52% compared to Rs 8.57 in Q1FY27, and increasing YoY by 6.15% compared to Rs 5.69 in Q2FY26. For H1FY27, consolidated basic EPS was Rs 14.61, indicating a YoY growth of 18.78% over Rs 12.30 in H1FY26. Segment-wise Performance: Consumer & Bazaar Segment Revenue: This segment registered revenue of Rs 3,197.82 crore in Q2FY27, down from Rs 3,458.25 crore in Q1FY27, and up from Rs 2,650.38 crore in Q2FY26; segment revenue for H1FY27 accumulated to Rs 6,656.07 crore compared to Rs 5,474.02 crore in H1FY26. Business to Business Segment Revenue: B2B revenue recorded Rs 820.37 crore in Q2FY27, compared to Rs 820.97 crore in Q1FY27 and Rs 673.31 crore in Q2FY26; segment revenue for H1FY27 was Rs 1,641.34 crore compared to Rs 1,381.06 crore in H1FY26. Others Segment Revenue: Revenue from other activities recorded Rs 24.57 crore in Q2FY27, compared to Rs 20.87 crore in Q1FY27 and Rs 13.82 crore in Q2FY26; segment revenue for H1FY27 was Rs 45.44 crore compared to Rs 28.05 crore in H1FY26. Sudhanshu Vats, Managing Director, Pidilite Industries, said: "We sustained the growth momentum in Q2FY27 with broad-based, double-digit UVG leading to 20% plus revenue growth. Despite very high material inflation, amidst unprecedented volatility and uncertainty, we delivered steady margins in H1FY27. We remain confident to continue the first-half business momentum into the second half of the year. We will continue to invest behind our brands, innovation and distribution. Our resilient business model and our disciplined execution will help us deliver profitable growth in the current environment." Result PDF | |
| 28 Oct 2026 | Pidilite Industries Ltd - 500331 - Earnings Presentation | Earnings Presentation |
Pidilite Industries Documents
Pidilite Industries Earnings Call
Pidilite Industries earnings calls, including management commentary and AI-generated summaries.
| Date | Title | Links |
|---|---|---|
| 29 Oct 2026 | Pidilite Industries Ltd - 500331 - Audio Recording Q2FY27 Earnings Call | Link |
| 29 Oct 2026 | Pidilite Industries Results Earnings Call for Q2FY27 | AudioVideo |
| 12 Aug 2026 | Pidilite Industries Ltd - 500331 - Announcement under Regulation 30 (LODR)-Earnings Call Transcript | Link |
| 05 Aug 2026 | Pidilite Industries Ltd - 500331 - Audio Recording Q1FY27 Earnings Call | Link |
| 05 Aug 2026 | Pidilite Industries Results Earnings Call for Q1FY27 | AudioVideo |
Pidilite Industries Annual Reports
Pidilite Industries financials, including annual results, balance sheets, and cash flow statements.
Pidilite Industries Credit Ratings
Pidilite Industries credit ratings from CRISIL and leading rating agencies, assessing financial stability, investment grade, and related PDF documentation.
| Date | Rating Agency | Company Name | Description | Links |
|---|---|---|---|---|
| 01 Sep 2026 | crisil ratings | Pidilite Industries Limited | Pidilite Industries Limited:Ratings reaffirmed at 'Crisil AAA / Stable / Crisil A1+ ' | Link |
| 01 Sep 2025 | crisil ratings | Pidilite Industries Limited | Pidilite Industries Limited:Ratings reaffirmed at 'Crisil AAA/Stable/Crisil A1+' | Link |
| 03 Sep 2024 | crisil ratings | Pidilite Industries Limited | Pidilite Industries Limited:Ratings Reaffirmed | Link |
| 27 Sep 2023 | crisil ratings | Pidilite Industries Limited | Pidilite Industries Limited:Ratings Reaffirmed | Link |
| 20 Oct 2022 | crisil ratings | Pidilite Industries Limited | Pidilite Industries Limited:Ratings Reaffirmed | Link |
Pidilite Industries Investor Presentations
Pidilite Industries investor presentations, including business updates, financial insights, and strategic initiatives.
| Date | Report Title | Links |
|---|---|---|
| 04 Aug 2026 | Pidilite Industries Ltd - 500331 - Announcement under Regulation 30 (LODR)-Investor Presentation | Link |
| 22 May 2026 | Pidilite Industries Ltd - 500331 - Announcement under Regulation 30 (LODR)-Investor Presentation | Link |
| 07 May 2026 | Pidilite Industries Ltd - 500331 - Announcement under Regulation 30 (LODR)-Investor Presentation | Link |
| 06 Feb 2026 | Pidilite Industries Ltd - 500331 - Announcement under Regulation 30 (LODR)-Investor Presentation | Link |
| 03 Feb 2026 | Pidilite Industries Ltd - 500331 - Announcement under Regulation 30 (LODR)-Investor Presentation | Link |
Pidilite Industries - Company Profile
Pidilite Industries Management Structure
Pidilite Industries management structure with salaries, total experience, and qualifications.
Pidilite Industries Board of Directors
Pidilite Industries Board of directors with salaries, total experience, and qualifications.
Pidilite Industries Brands
Brands owned by Pidilite Industries
| LOGO | BRAND NAME |
|---|---|
 | Dr. Fixit |
 | Fevikwik |
 | M-Seal |
 | Fevicol |
 | Hobby Ideas |
 | Fevicryl |
 | Motomax |
| LOGO | BRAND NAME |
|---|---|
 | WD-40 |
 | Fevibond |
 | Ranipal |
 | USPRO |
 | DDL |
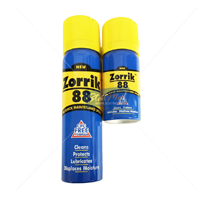 | Zorrik 88 |
 | Upscale |
| LOGO | BRAND NAME |
|---|---|
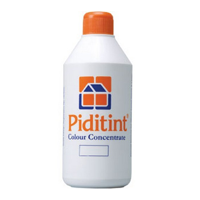 | Piditint |
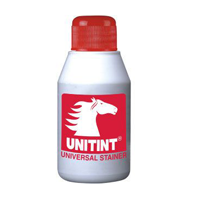 | Unitint |
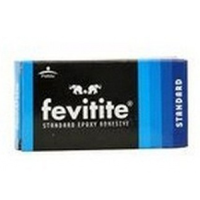 | Fevitite |
 | Brite-O |
 | Prime |
 | Fine Art |
 | Wudfin |
| LOGO | BRAND NAME |
|---|---|
 | Fevigum |
 | Steelgrip |
 | Terminator |
 | Rangeela |
 | Roff |
 | Fevistik |
Website: www.pidilite.com
About the company - Business Profile
Pidilite Industries Ltd. is a leading manufacturer of consumer and specialty chemicals in India. The company holds a dominant market position in the adhesives and sealants category, underpinned by its flagship brand, Fevicol, which has become synonymous with adhesives in the Indian market. Its product portfolio extends across construction chemicals, art and craft materials, and industrial specialty chemicals, serving both retail consumers and industrial clients.
Key Points
Key Facts
- Founded Year: Established in 1959.
- Headquarters: Mumbai, Maharashtra.
- Stock Listing: Listed on the Bombay Stock Exchange (BSE) and National Stock Exchange (NSE).
- Key Brands: Fevicol, Dr. Fixit, M-Seal, Fevikwik, Fevistik, Roff, Fevicryl, and Araldite (acquired in 2020).
Operations and Resources
- Manufacturing & R&D: The company operates 33 plants in India and has international manufacturing setups in Thailand, Dubai, Egypt, Bangladesh, Sri Lanka, and Kenya.
- R&D Capability: Operates 5 R&D centers in India and 1 in Singapore.
- Distribution Network: Supported by over 4,900 distributors (standalone) and a network of 48 warehouses and 9 regional offices.
Ownership and Structure
- Shareholding Pattern (as of December 31, 2025):
- Promoters: 69.33%
- FPIs: 14.11%
- Mutual Funds: 12.00%
- Others: 4.56%
- Subsidiaries: The company has 14 domestic subsidiaries (including one partnership and six associates) and 19 international subsidiaries (5 direct and 14 step-down).
Business Model and Segment Performance Pidilite operates primarily through two segments: Consumer & Bazaar (C&B) and Business to Business (B2B). The C&B segment contributes the majority of revenue and includes products for end consumers like carpenters, painters, and students.
- FY 2024-25 Revenue Breakdown (Standalone):
- Domestic Revenue: Rs. 11,079 crore.
- Export Revenue: Rs. 993 crore.
- FY 2024-25 Revenue by Segment:
- Consumer & Bazaar: Approximately 81.2% of total revenue.
- Business to Business: Approximately 18.4% of total revenue.
- Q3 FY 2025-26 Performance (Standalone):
- Net Sales: Rs. 3,425 crore (11% growth YoY).
- EBITDA: Rs. 840 crore (12.1% growth YoY).
- EBITDA Margin: 24.5%.
Technology and Innovation
- Product Advancement: Recent launches include the Feviseal brand of construction and adhesive sealants and the successful integration and doubling of sales for Araldite post-acquisition.
- Digital Initiatives: Implementation of "kwik GPT" (AI pack generation) for marketing and consumer engagement, which saw over 840,000 user generations.
- Innovation Awards: Received the Innovative Practice Award at the 7th Digital Transformation (DX) Awards 2025.
Workforce and Human Resources
- Employee Count: Over 8,500 employees at the standalone level.
- Attrition Trends: In FY 2024-25, the turnover rate for permanent employees was 12%, compared to 11% in FY 2023-24.
Strategic Initiatives and Outlook
- Market Expansion: Focus on distribution expansion in rural markets and scaling up the supply chain through 31 co-makers and enhanced regional distribution centers.
- Awards: The Chairman, Mr. Madhukar Parekh, was named Best CEO 2025 by Fortune India and received a Lifetime Achievement Award from the Indian Chemical Society in 2025.
References