Nifty IT Share Price Today and Live Chart - PE Ratio, PB, EPS, Dividend yield, ETFs, Performance, FnO
Nifty IT Index
- 36.28000.81 (2.28%)
- SBI Nifty IT ETFSBIIT360.40006.26 (1.77%)
- 36.23000.77 (2.17%)
Nifty IT Performance: Nifty IT Index Today, Week, Month, Year Change
Nifty IT index today and over the week, month and year


- < -5%
- -2 to -5%
- 0 to -2%
- 0 to 2%
- 2 to 5%
- > 5%
Technical Analysis
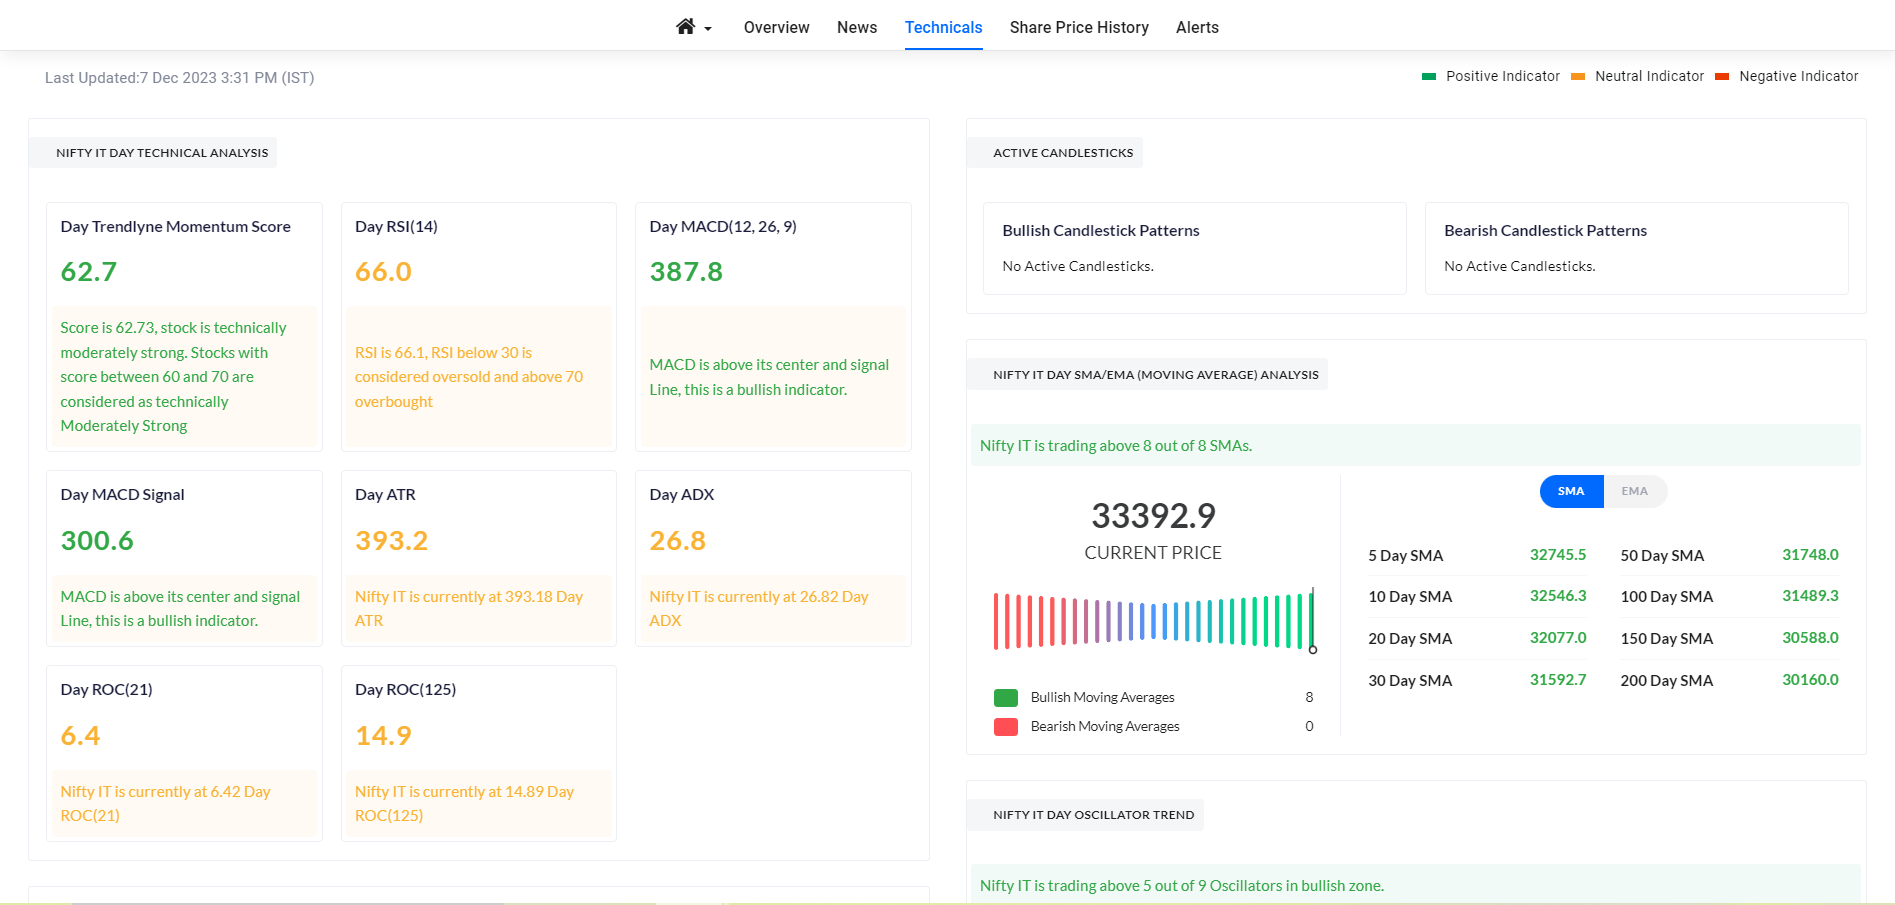
Nifty IT EMA & SMA
| 5 Day | 32107.1 |
|---|---|
| 10 Day | 31698.5 |
| 12 Day | 31515.8 |
| 20 Day | 30932.7 |
| 26 Day | 30660.3 |
|---|---|
| 50 Day | 30179.9 |
| 100 Day | 30084.9 |
| 200 Day | 31035.8 |
Nifty IT Active Candlesticks
Nifty IT Resistance and Support
| First Resistance | 32882.4 |
|---|---|
| Second Resistance | 33157.9 |
| Third Resistance | 33610.3 |
| First Support | 32154.5 |
|---|---|
| Second Support | 31702.1 |
| Third Support | 31426.6 |
| Day RSI | 67.7 |
|---|---|
| Day MACD | 855.6 |
| Day MFI | - |
| Day MACD Signal Line | 654.9 |
Nifty IT Price Change Analysis
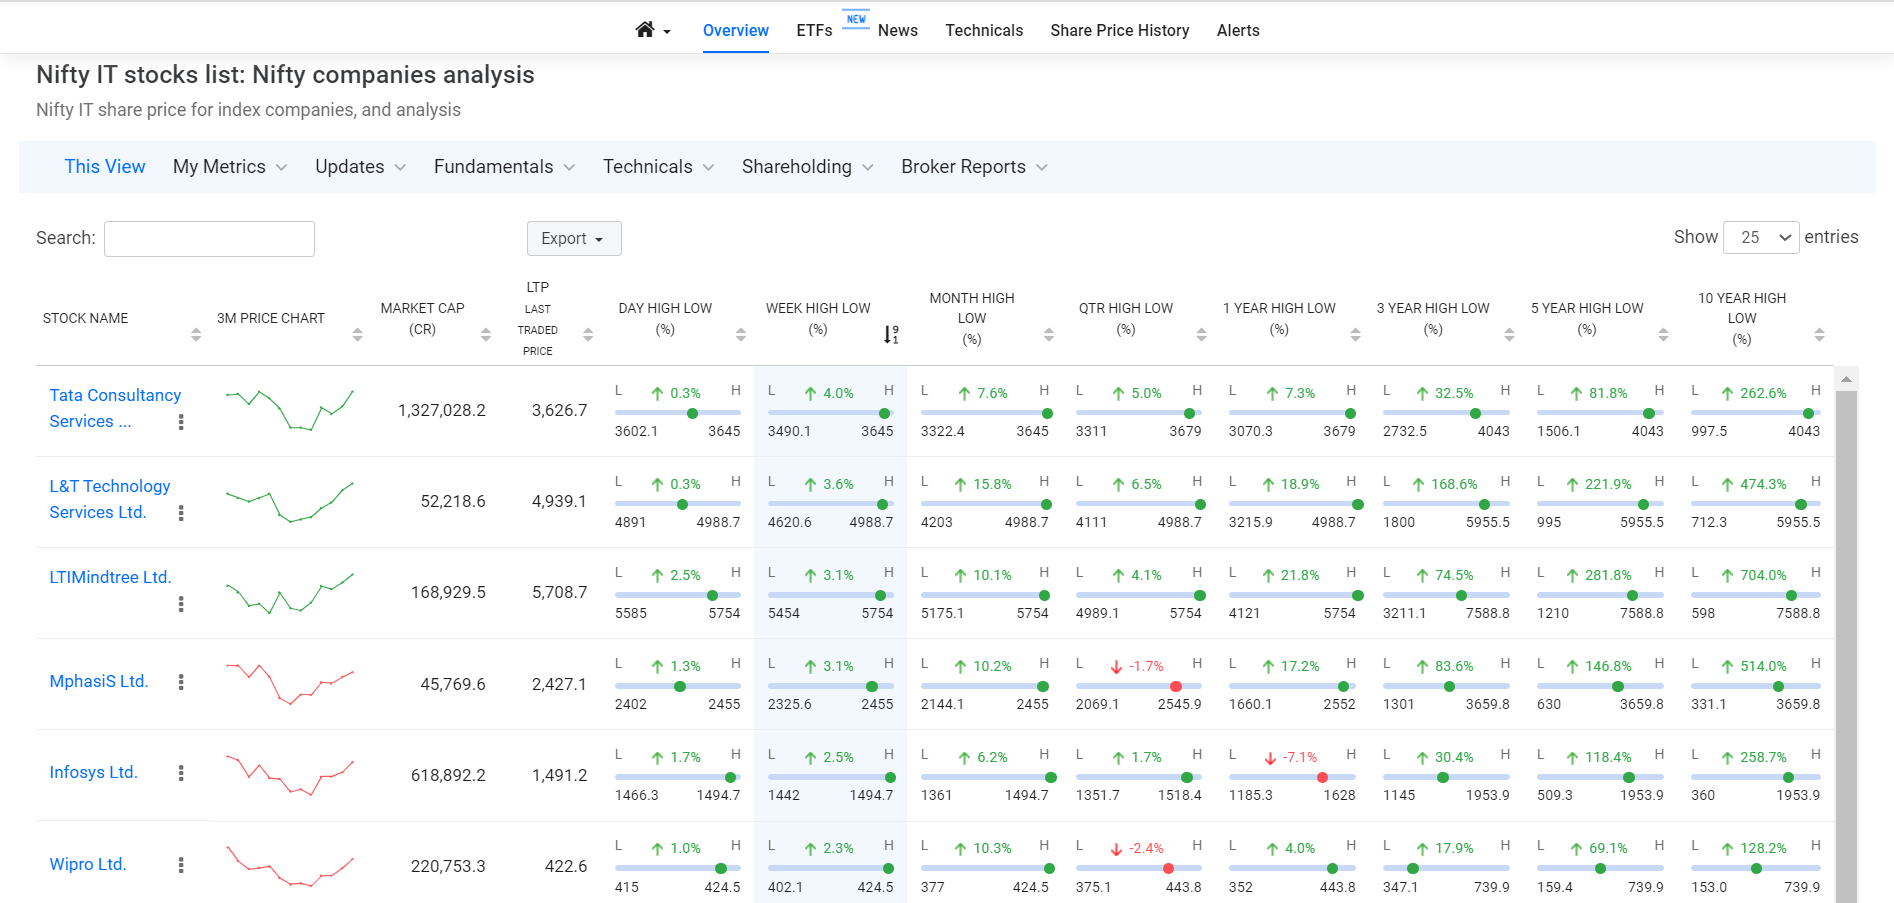
Nifty IT stocks list: Nifty IT companies analysis
Nifty IT share price for index companies, and analysis
| Stock Name | 3M Price Chart | Market Cap | LTP Last Traded Price | Day High Low (%) | Week High Low (%) | Month High Low (%) | Qtr High Low (%) | 1 Year High Low (%) | 3 Year High Low (%) | 5 Year High Low (%) | 10 Year High Low (%) |
|---|---|---|---|---|---|---|---|---|---|---|---|
| TCS | 905,462.6 | 2,502.6 | L 1.0%H 2494.22527.7 | L -1.1%H 2408.22549.7 | L 22.0%H 2045.12625 | L 5.8%H 2032.42625 | L -18.2%H 1976.83350 | L -25.7%H 1976.84592.3 | L -26.3%H 1976.84592.3 | L 109.3%H 1026.04592.3 | |
| Infosys | 480,907.6 | 1,185 | L 3.4%H 1147.91185 | L 2.7%H 1103.41185 | L 19.2%H 990.11197.8 | L 4.9%H 980.41197.8 | L -20.1%H 980.41728 | L -13.4%H 980.42006.5 | L -28.9%H 980.42006.5 | L 136.5%H 4302006.5 | |
| HCL Technologies | 387,538.5 | 1,428.1 | L 1.7%H 14101452 | L 0.4%H 13641452 | L 16.1%H 1172.81467.5 | L 6.0%H 1172.81467.5 | L -7.4%H 10301780.1 | L 11.9%H 10302012.2 | L 24.9%H 877.42012.2 | L 272.0%H 3682012.2 | |
| Wipro | 196,439.1 | 198.3 | L 4.3%H 190.8198.3 | L 4.5%H 182.3198.3 | L 25.1%H 157.3198.3 | L 8.0%H 156.8198.3 | L -17.6%H 156.8273.1 | L 3.9%H 156.8324.6 | L -38.7%H 156.8363.4 | L 127.7%H 76.5369.9 | |
| Tech Mahindra | 175,535.1 | 1,790.8 | L 1.2%H 1773.61813.4 | L 0.0%H 1733.21813.4 | L 17.5%H 1442.51845 | L 8.5%H 1442.51845 | L 25.7%H 1304.11854 | L 58.0%H 1113.81854 | L 21.2%H 943.71854 | L 307.3%H 356.71854 | |
| LTM | 125,583.1 | 4,233.5 | L 3.4%H 4109.54257 | L 2.4%H 39264257 | L 4.7%H 3905.64419.5 | L -3.0%H 3905.64850 | L -25.5%H 35286429.5 | L -16.3%H 35286768.0 | L -36.6%H 35287588.8 | L 554.0%H 5987588.8 | |
| Persistent Systems | 100,296.4 | 6,048 | L 2.9%H 58846048.5 | L 5.6%H 56006048.5 | L 14.6%H 5250.56078 | L 9.0%H 51626078 | L 2.2%H 4244.56599 | L 96.4%H 3063.86788.9 | L 208.3%H 1546.06788.9 | L 1745.9%H 210.06788.9 | |
| Coforge | 90,606.4 | 2,045 | L 4.2%H 19722061.8 | L 7.6%H 1812.22061.8 | L 16.9%H 1763.62061.8 | L 18.8%H 17172061.8 | L 15.0%H 1008.12061.8 | L 105.1%H 857.52061.8 | L 109.9%H 642.02061.8 | L 2398.5%H 73.32061.8 | |
| Oracle Fin Serv | 87,093.0 | 9,995 | L 0.6%H 981510022 | L 3.3%H 954010337 | L -6.0%H 954010812 | L -10.7%H 954012540 | L 17.4%H 6234.512540 | L 157.8%H 3871.313220 | L 125.9%H 2883.313220 | L 212.0%H 150613220 | |
| Mphasis | 48,005.8 | 2,525.6 | L -1.4%H 2516.62591.3 | L 1.8%H 24352618.4 | L 17.2%H 2160.12618.4 | L 7.8%H 2144.82618.4 | L -8.6%H 20132975 | L 18.9%H 20133238.0 | L -21.9%H 1660.13494.8 | L 392.2%H 465.13659.8 |
Nifty IT FAQ
The Nifty IT Index consists of highly liquid and large-cap Indian information technology (IT) stocks. Serving as a benchmark, it offers investors and market intermediaries a snapshot of the capital market’s performance specifically within the Indian IT sector.
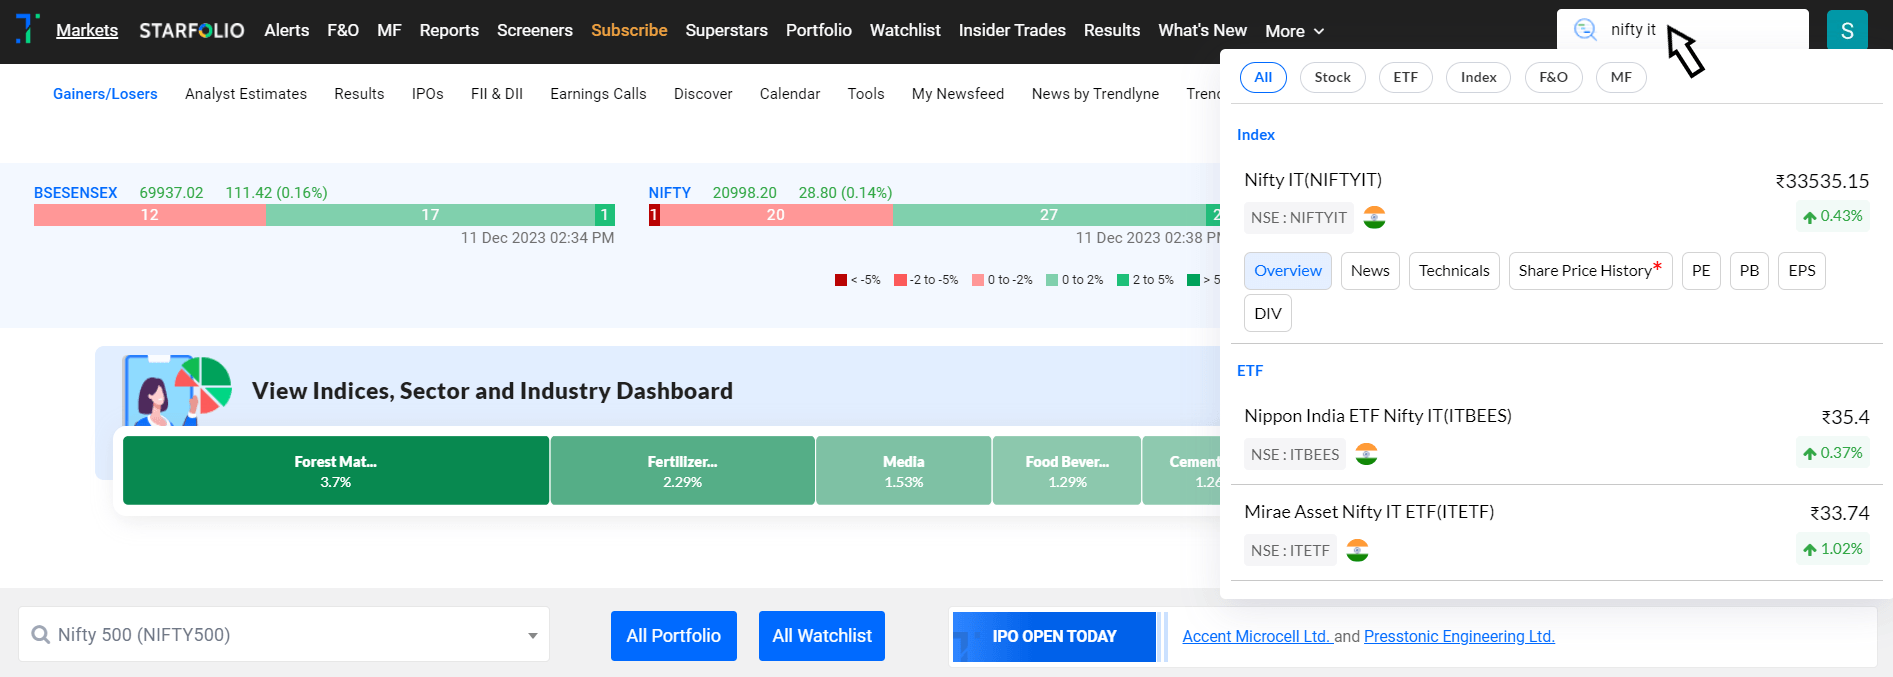
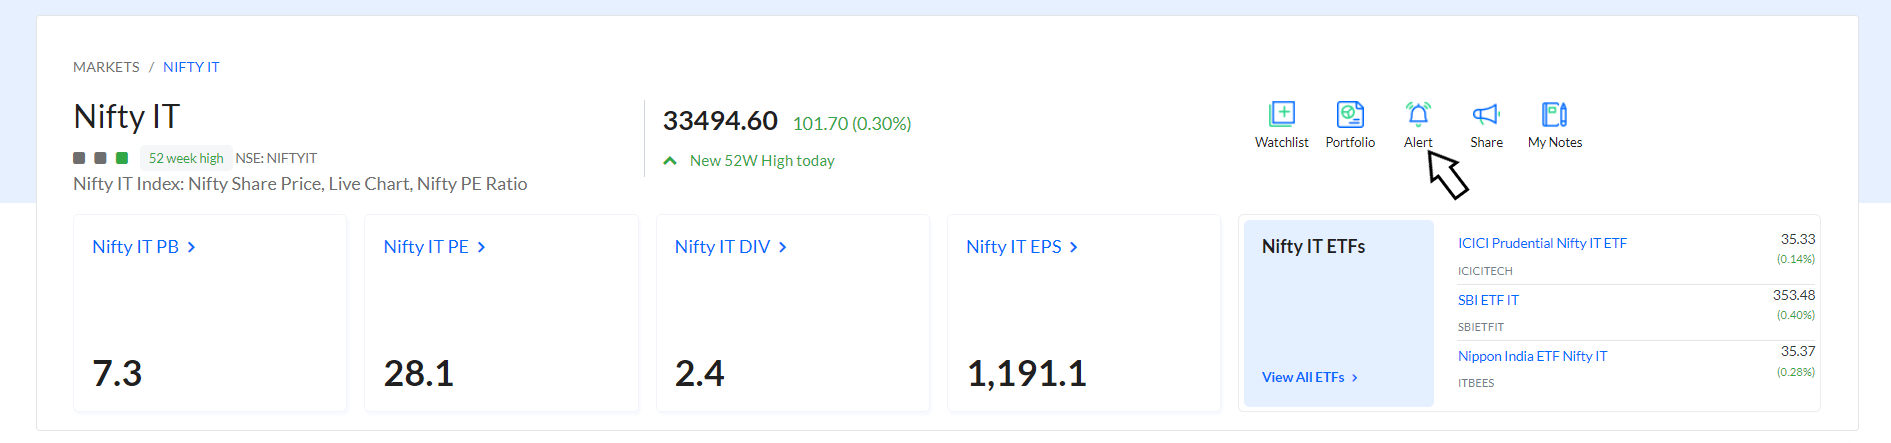
The index page can be accessed from the markets page. You can type “Nifty IT” in the search bar in the top right corner beside your profile icon.
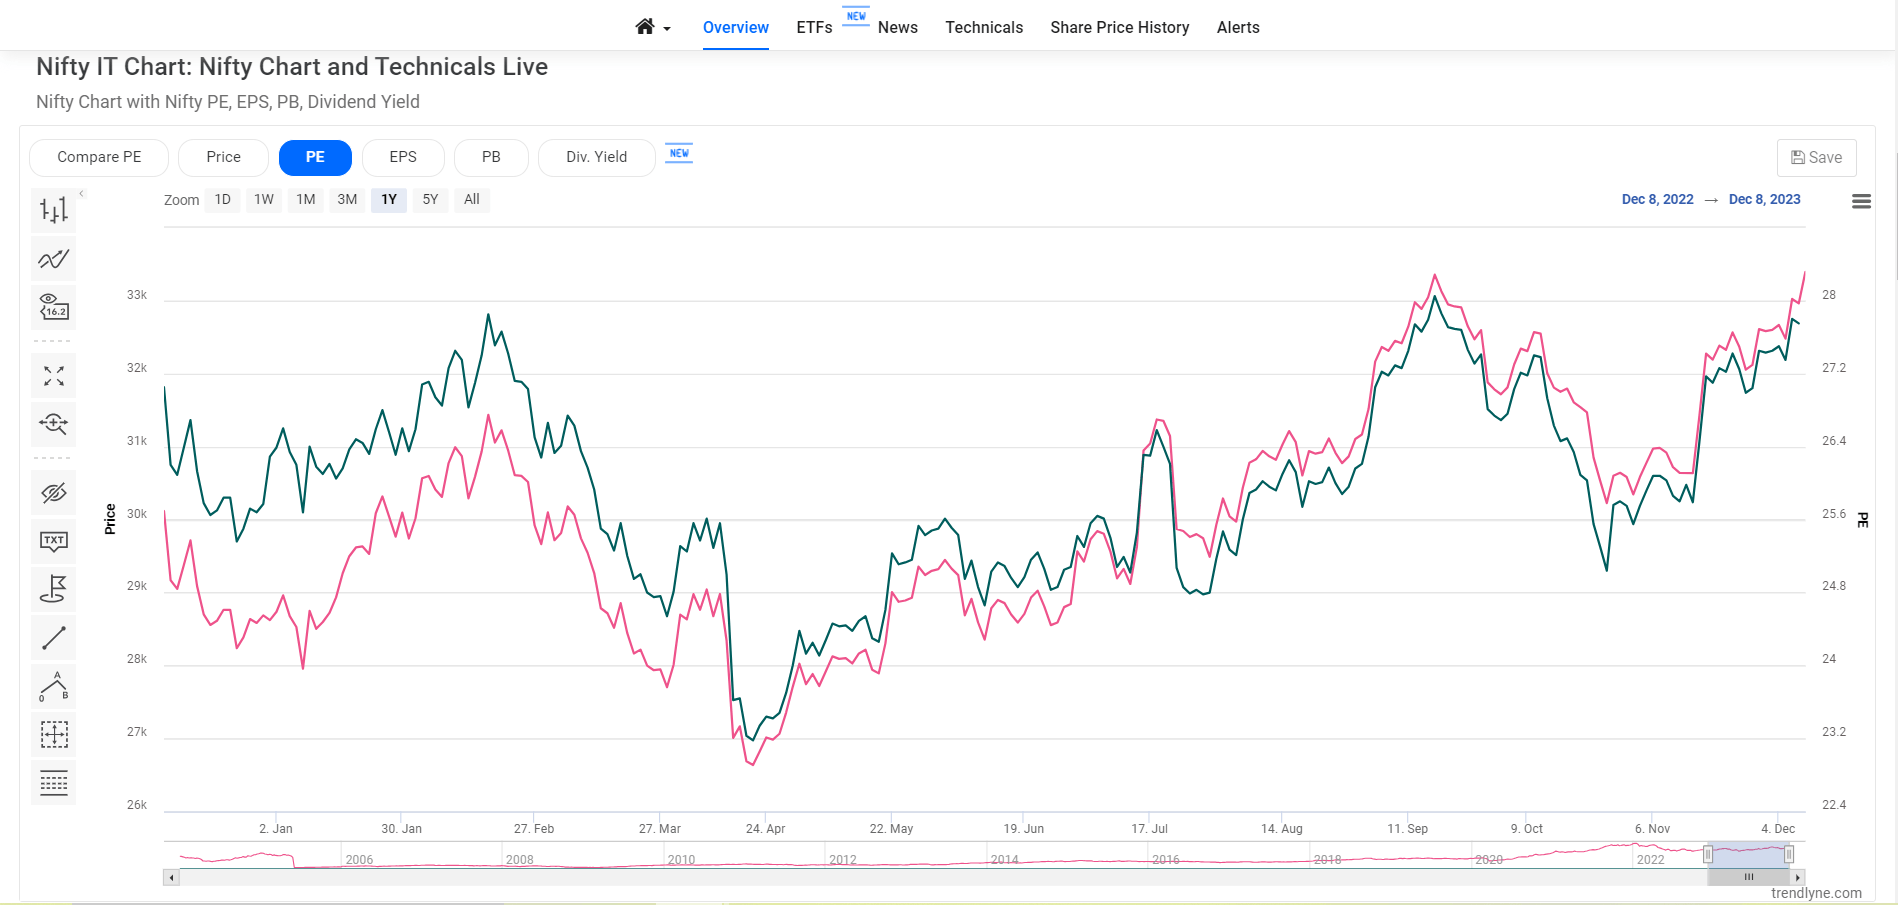
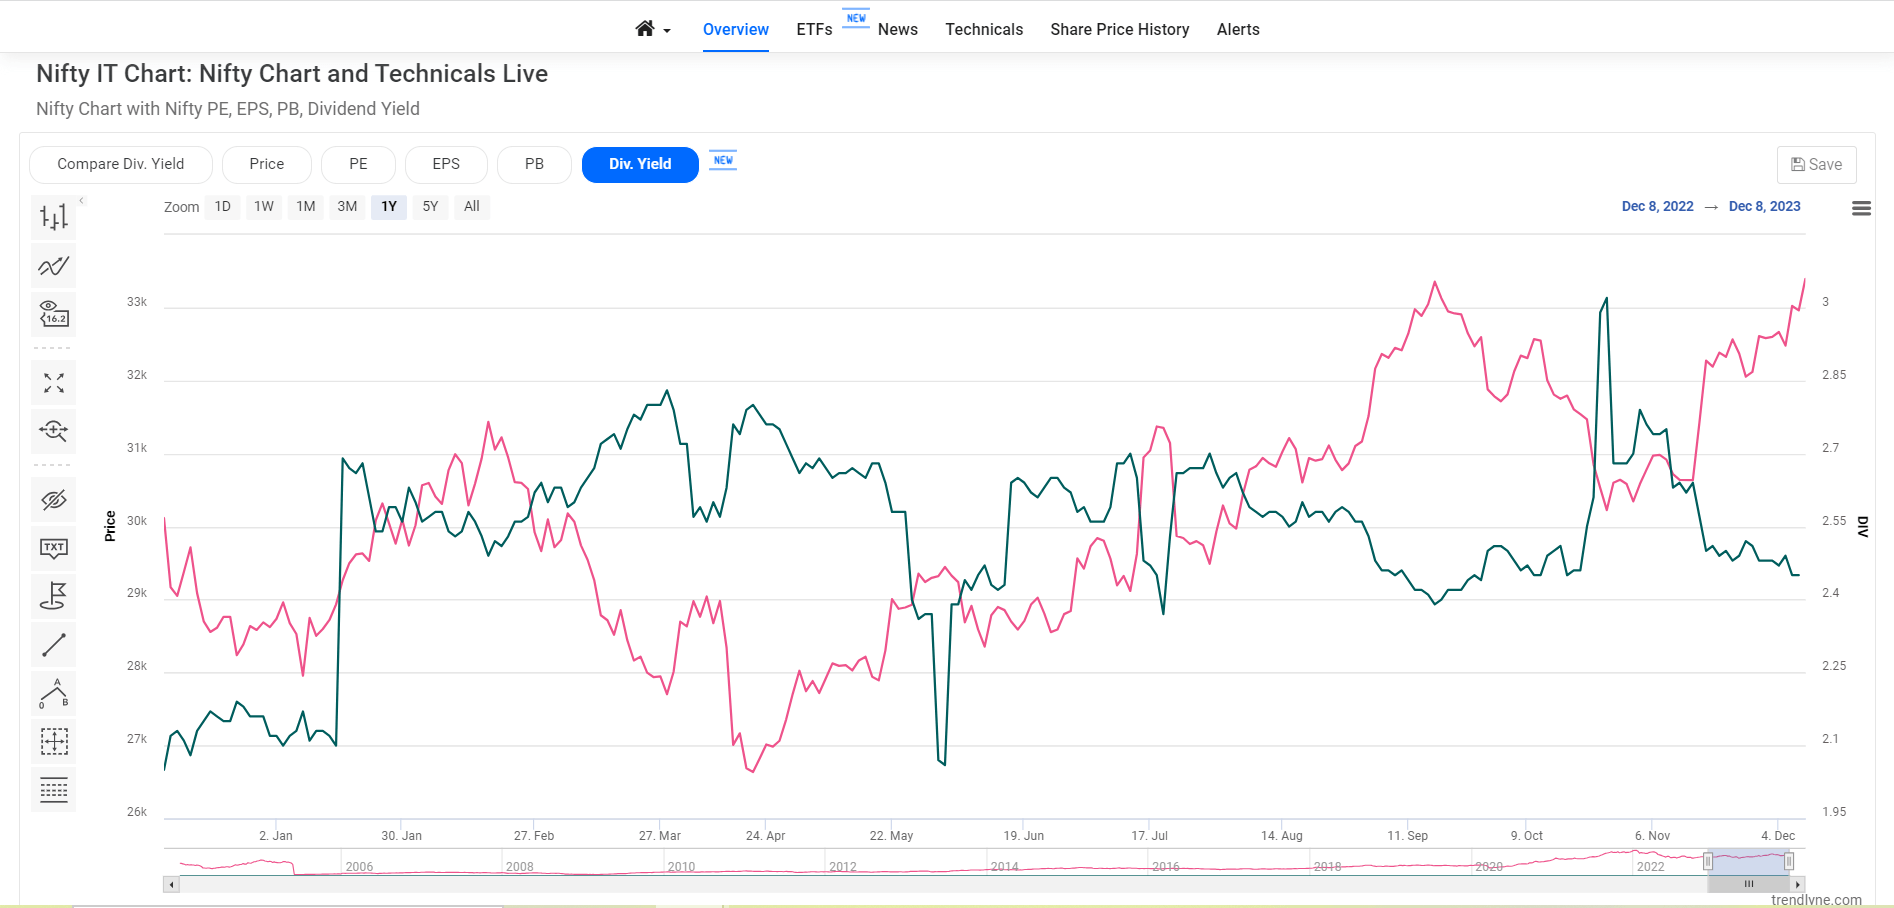
The Nifty IT PE or Nifty IT PB charts can be viewed in the index page overview section where one can select parameters for PE or PB. You can scroll down in the overview section to find these charts.
The Nifty IT's dividend yield varies over time, reflecting the annual dividends relative to its price. It indicates potential income, influenced by dividends and index prices. You can scroll down in the overview section to find these charts.
The Nifty IT index undergoes semi-annual rebalancing, scheduled on January 31 and July 31 each year. The review period spans six months leading up to the respective cut-off date, with average data considered for this evaluation. A four-week notice period precedes any changes, providing the market with advance information.
You can find the analysis of Nifty IT technicals under the Technicals section on the Nifty IT page, with the MACD, SMAs, RSI, ADX, etc.