
- POSITIVE
Quarterly Revenue Pfizer Jun-2026 Quarterly Revenue is Rs 698 Cr which is growth of 4.1% YoY.
- POSITIVE
Quarterly Net Profit Pfizer Jun-2026 Quarterly Net Profit is Rs 204 Cr which is growth of 6.6% YoY.
NSE: PFIZER | BSE: 500680
Pfizer Live Share Price Today, Share Analysis and Chart
aboutPfizer Limited is a leading pharmaceutical company in India, operating as a subsidiary of the global biopharmaceutical giant Pfizer Inc. The company focuses on the discovery, development, and manufacturing of healthcare products, primarily in the are... Read More
3821.60182.90(5.03%)
321.9K
NSE+BSE Volume
NSE 03 Nov, 2026 3:31 PM (IST)
Mid-range PerformerThese stocks have strong quality. Their reasonable financials and technicals make them potentially attractive to investorsView SimilarEmbed DVM
Please subscribe to view forecaster data
Pfizer Stock Price Analysis
Day Price Range5.0% 1 Day return | 3821.6 (LTP) 3,633.13,892.9 LowHigh |
|---|---|
Week Price Range3.6% 1 Week return | 3821.6 (LTP) 3,613.63,892.9 LowHigh |
Month Price Range-1.0% 1 Month return | 3821.6 (LTP) 3,5894,123.9 LowHigh |
52 Week Price Range-26.6% 1 Year return | 3821.6 (LTP) 3,5895,339 LowHigh |
Pfizer Forecaster - Analyst Share Price Target and Estimates
Revenue forecast
EPS forecast
CURRENT EPS
AVG. ESTIMATE
Consensus Recommendation
4 ANALYST Recommendations
BUY
Forecaster is a Premium Feature
You need to upgrade your subscription plan to access this feature
See what you get Forecaster
Competitors/Peers
Revenue Mix
Quarterly
Annual
Balance Sheet
Ratios
Cash Flow
Documents
Pfizer quarterly results: revenue, profit, and P&L – 13 quarter history
Nested row level
Base Level
Reporting Type
Standalone
Cell Data
Actual
Table Settings
YoY & New to Old
Nested row level
Base Level
Export
| Indicator | Graph | Jun '26 | Mar '26 | Dec '25 | Sep '25 | Jun '25 | Mar '25 | Dec '24 | Sep '24 | Jun '24 | Mar '24 | Dec '23 | Sep '23 | Jun '23 |
|---|---|---|---|---|---|---|---|---|---|---|---|---|---|---|
| 698 | 670 | 683.2 | 684.2 | 670.2 | 636.5 | 580.8 | 631.7 | 604.7 | 621.8 | 575.8 | 611.3 | 564.8 | ||
Operating Exp. | 405.6 | 393.3 | 416.8 | 412.4 | 393 | 364.4 | 392 | 399.3 | 385.4 | 357.2 | 387.4 | 392.6 | 420.7 | |
Operating Profit | 247.6 | 236 | 228.2 | 229.9 | 210 | 227.5 | 146 | 189.3 | 177.5 | 189.4 | 152.6 | 182.6 | 110.7 | |
Operating Profit Margin % | 37.90% | 37.50% | 35.38% | 35.80% | 34.83% | 38.43% | 27.14% | 32.15% | 31.53% | 34.65% | 28.25% | 31.75% | 20.84% | |
Depr. | 14.3 | 14.8 | 14.3 | 14.3 | 14.4 | 16.4 | 14.8 | 15 | 14.6 | 13.8 | 17.6 | 15.4 | 15.6 | |
Interest | 1.5 | 2.1 | 2 | 2.1 | 3.3 | 2.7 | 1.5 | 2.1 | 2.1 | 7 | 2.9 | 2.7 | 2.9 | |
Profit Before Tax | 276.7 | 268.8 | 192 | 255.4 | 259.5 | 425.8 | 172.4 | 215.2 | 202.6 | 243.9 | 175.9 | 200.5 | 125.8 | |
Tax | 72.2 | 69 | 50.1 | 66.4 | 67.8 | 94.9 | 44.8 | 56.9 | 51.9 | 65 | 46 | 51.6 | 32.2 | |
Net Profit | 204.5 | 199.8 | 141.8 | 189 | 191.8 | 330.9 | 127.6 | 158.4 | 150.7 | 178.9 | 130 | 149 | 93.5 | |
EPS Adj. latest | 44.7 | 43.7 | 31 | 41.3 | 41.9 | 72.3 | 27.9 | 34.6 | 32.9 | 39.1 | 28.4 | 32.6 | 20.4 | |
Net profit TTM | 735.2 | 722.4 | 853.6 | 839.3 | 808.6 | 767.6 | 615.5 | 617.9 | 608.5 | 551.3 | 502.1 | 522.8 | 684.9 | |
Basic EPS TTM | 160.7 | 157.9 | 186.6 | 183.5 | 176.8 | 167.8 | 134.5 | 135.1 | 133 | 120.5 | 109.8 | 114.3 | 149.7 | |
Results PDF | ||||||||||||||
Result Notes |
*All financials are in INR Cr and price data in INR
Add metric to table
Search...
Pfizer Technical Analysis
Pfizer EMA & SMA
Neutral0
4 bullish, 4 bearish
Bullish4
Bearish4
| 5 Day | 3690.8 |
|---|---|
| 10 Day | 3721.3 |
| 12 Day | 3734.4 |
| 20 Day | 3795.4 |
| 26 Day | 3847.7 |
|---|---|
| 50 Day | 4040.5 |
| 100 Day | 4279.5 |
| 200 Day | 4508.4 |
Pfizer Delivery And Volume
Daily Avg. Delivery Volume %
02 Nov, 202667.1%
Week61.5%
Month64.9%
Legend
Positive IndicatorNeutral IndicatorNegative Indicator
Pfizer Resistance and Support
3656.83
Pivot
| First Resistance | 3700.1 |
|---|---|
| Second Resistance | 3761.4 |
| Third Resistance | 3804.7 |
| First Support | 3595.5 |
|---|---|
| Second Support | 3552.2 |
| Third Support | 3490.9 |
| Day RSI | 34.1 |
|---|---|
| Day MACD | -113.3 |
| Day MFI | 33.2 |
| Day MACD Signal Line | -124.1 |
Pfizer Beta
| 1 Month | 0.6 |
|---|---|
| 1 Year | 0.6 |
| 3 Month | 0.6 |
|---|---|
| 3 Year | 0.4 |
Pfizer Price Change Analysis
↓-1.0%
Over 1 Month
LowHigh
35894123.9
↓-20.8%
Over 3 Months
LowHigh
35895149
↓-18.9%
Over 6 Months
LowHigh
35895149
↓-26.6%
Over 1 Year
LowHigh
35895339
Pfizer Deals - Insider, Bulk, Block and SAST
| Client Name | Deal Type | Action | Date | Avg. Price | Quantity | Exchange |
|---|---|---|---|---|---|---|
| QUANT MUTUAL FUND | Bulk | Purchase | 20 Aug 2026 | 4899.97 | 267,864 | BSE |
| GOLDMAN SACHS FUNDS - GOLDMAN SACHS INDIA EQUITY PORTFOLIO | Bulk | Sell | 24 Apr 2026 | 4700.01 | 426,066 | BSE |
| PRUDENTIAL ICICI MUTUAL FUND A/C DISCOVERY FUND | Bulk | Purchase | 24 Apr 2026 | 4700 | 400,000 | BSE |
Pfizer Corporate Actions
Pfizer Dividend history and yield
Pfizer dividend yields, including actual and adjusted, and dividend history, including announcement, record, and ex-dividend dates. Track Pfizer dividend yield over time.
#Ex-Date | Dividend Amount | Dividend Type | Record Date | Instrument Type |
|---|---|---|---|---|
117 Jul 2026 | 75 | FINAL | 17 Jul 2026 | Equity Share |
209 Jul 2025 | 130 | SPECIAL | 09 Jul 2025 | Equity Share |
309 Jul 2025 | 35 | FINAL | 09 Jul 2025 | Equity Share |
421 Aug 2024 | 35 | FINAL | 21 Aug 2024 | Equity Share |
511 Aug 2023 | 5 | SPECIAL | 11 Aug 2023 | Equity Share |
Pfizer Bonus shares
Pfizer bonus history along with announcement, record, ex-bonus dates, and bonus ratios.
#Ex-Date | Bonus Ratio | Record Date |
|---|---|---|
112 Jun 2000 | 1:1 | 28 Jun 2000 |
Pfizer Board Meetings
Pfizer past and upcoming board meetings.
#Ex-Date | Purpose | Notes |
|---|---|---|
103 Nov 2026 | Quarterly Results | - |
228 Jul 2026 | Quarterly Results | - |
312 May 2026 | Audited Results & Final Dividend | - |
409 Feb 2026 | Quarterly Results | - |
512 Nov 2025 | Quarterly Results | - |
Pfizer Research Reports
Pfizer research reports with share price targets, and buy/hold/sell recommendations from top brokers.
# Date | Broker Name | Target | Price When Recommended | Type | Upside | Change Since Recommendation | Links |
|---|---|---|---|---|---|---|---|
| 128 Jul 2026 | ICICI Direct Target | 5815 | 4755.1 | Buy | 22.29% | -19.63% | |
| 227 Jul 2026 | ICICI Securities Limited | 6000 | 4710.7 | Buy | 27.37% | -18.87% | |
| 309 Jul 2026 | ICICI Securities Limited | 6000 | 4731.4 | Buy | 26.81% | -19.23% | |
| 412 May 2026 | ICICI Direct | 5750 | 4613.5 | Buy | 24.63% | -17.16% | |
| 509 Feb 2026 | ICICI Direct Reco Target | 6030 | 4960.8 | Buy | 21.55% | -22.96% |
Pfizer Corporate Filings
Pfizer BSE corporate filings and AGM, press releases, insider trading & SAST, results and corporate actions.
| Date | Announcement Title | Details | Links |
|---|---|---|---|
| 03 Nov 2026 | Q2FY27 Quarterly Result Announced for Pfizer Ltd. | Pharmaceuticals company Pfizer announced Q2FY27 results Financial Highlights: Total income: For Q2FY27, Total income was Rs 774.19 crore, growing by 10.91% QoQ from Rs 698.01 crore in Q1FY27 and by 13.15% YoY from Rs 684.19 crore in Q2FY26. For H1FY27, Total income achieved Rs 1,472.20 crore, registering an 8.70% YoY increase from Rs 1,354.41 crore in H1FY26. Revenue from operations: During Q2FY27, Revenue from operations stood at Rs 726.86 crore, shifting upwards by 11.28% QoQ from Rs 653.17 crore in Q1FY27 and up 13.16% YoY from Rs 642.34 crore in Q2FY26. For H1FY27, cumulative Revenue from operations was Rs 1,380.03 crore, marking a 10.81% YoY increase from Rs 1,245.39 crore in H1FY26. Profit Before Tax (PBT): For Q2FY27, PBT reached Rs 422.83 crore, showing a sequential increase of 52.82% QoQ against Rs 276.68 crore in Q1FY27 and an annual increase of 65.58% YoY against Rs 255.37 crore in Q2FY26. For H1FY27, PBT stood at Rs 699.51 crore, rising 35.85% YoY from Rs 514.90 crore in H1FY26. Profit After Tax (PAT): Standalone PAT for Q2FY27 was reported at Rs 313.25 crore, increasing by 53.20% QoQ from Rs 204.47 crore in Q1FY27 and expanding by 65.72% YoY from Rs 189.02 crore in Q2FY26. For H1FY27, PAT reached Rs 517.72 crore, representing a 35.97% YoY growth over Rs 380.77 crore in H1FY26. Earnings Per Share (EPS): Basic and Diluted EPS for Q2FY27 was Rs 68.47, demonstrating a 53.21% QoQ change from Rs 44.69 in Q1FY27 and a 65.71% YoY change from Rs 41.32 in Q2FY26. For H1FY27, EPS stood at Rs 113.17, highlighting a 35.97% YoY improvement over Rs 83.23 in H1FY26. Result PDF | |
| 03 Nov 2026 | Pfizer Ltd - 500680 - Board Meeting Outcome for Unaudited Financial Results For The Quarter And Half Year Ended September 30, 2026. | Please find enclosed unaudited financial results for the quarter and half year ended September 30, 2026 along with the limited review report. | |
| 26 Oct 2026 | Pfizer Ltd - 500680 - Board Meeting Intimation for Board Meeting To Consider And Approve The Unaudited Financial Results For The Quarter And Half Year Ended September 30, 2026. | Pfizer Ltdhas informed BSE that the meeting of the Board of Directors of the Company is scheduled on 03/11/2026 ,inter alia, to consider and approve This is to inform you that a meeting of the Board of Directors of the Company is scheduled to be held on Tuesday, November 3, 2026 to consider, approve and take on record the unaudited financial results for the quarter and half year ended September 30, 2026. | |
| 09 Oct 2026 | Pfizer Ltd - 500680 - Compliances-Certificate under Reg. 74 (5) of SEBI (DP) Regulations, 2018 | Please find attached Certificate under Regulation 74(5) of SEBI (Depositories and Participants) Regulations, 2018 for the quarter ended September 30, 2026. | |
| 02 Oct 2026 | Pfizer Ltd - 500680 - Announcement under Regulation 30 (LODR)-Newspaper Publication | Please find enclosed copy of newspaper advertisements for Transfer and Dematerialisation of Physical Securities. |
Pfizer Documents
Pfizer - Company Profile
Pfizer Management Structure
Pfizer management structure with salaries, total experience, and qualifications.
Pfizer Board of Directors
Pfizer Board of directors with salaries, total experience, and qualifications.
Pfizer Brands
Brands owned by Pfizer
| LOGO | BRAND NAME |
|---|---|
 | LC-OD Plus |
 | Erythrocin |
 | Dolonex |
 | Corex DX |
 | Amlogard-Met |
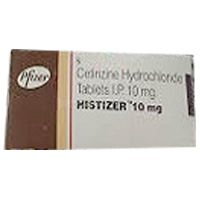 | Histizer |
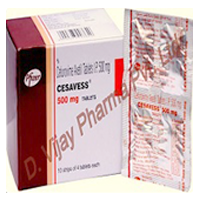 | Cesavess |
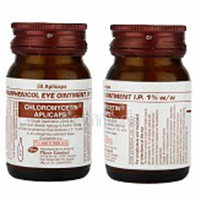 | Chloromycetin |
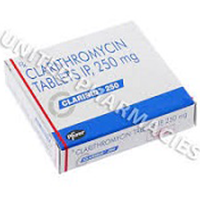 | Claribid |
 | Fasigyn |
 | Isokin |
 | Jetex |
 | Jetflox |
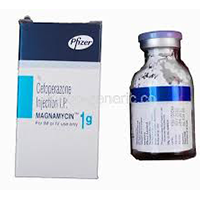 | Magnamycin |
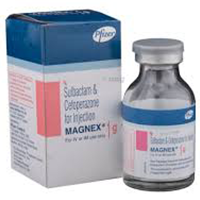 | Magnex |
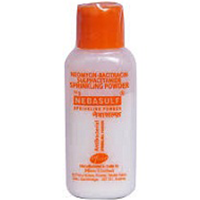 | Nebasulf |
 | Roxify |
 | Terramycin |
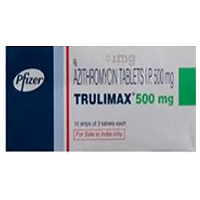 | Trulimax |
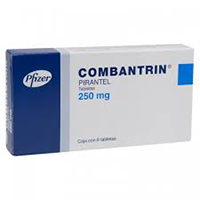 | Combantrin A |
 | Acupil |
 | Amlogard |
 | Amlogard TM |
 | Cyklokapron |
 | Eliquis |
 | Lopid |
 | Minipress XL |
 | Newsta-F |
 | Nicopress |
| LOGO | BRAND NAME |
|---|---|
 | Targit |
 | Tritorvis |
 | Tadalift |
 | Viagra |
 | Above 5 |
 | Agarol |
 | Etuser |
 | Etuser DSR |
 | Gelusil |
 | Noxantor |
 | Noxantor DSR |
 | Pantoprazole |
 | Becosule Capsules |
 | Dilantin |
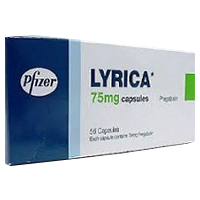 | Lyrica |
 | Dolonat |
 | Equiflex |
 | Pactiv |
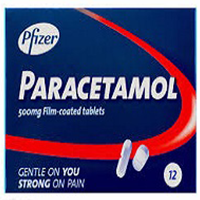 | Pfizer’s Paracetamol |
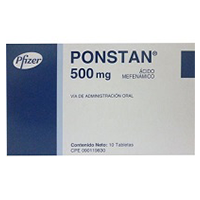 | Ponstan |
 | Sloans |
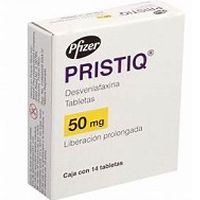 | Pristiq |
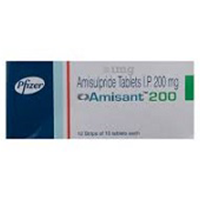 | Amisant |
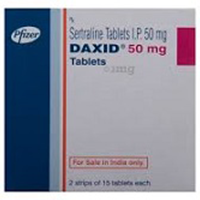 | Daxid |
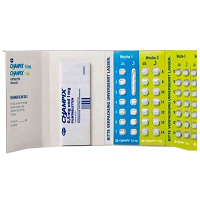 | Champix |
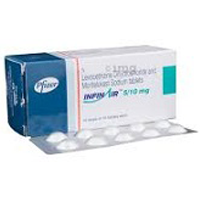 | Infinair |
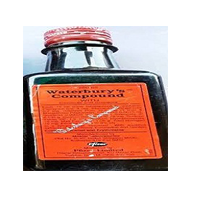 | Waterburys Compound |
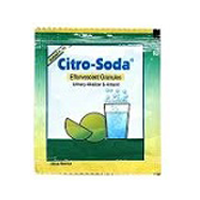 | Citro soda |
 | Becotrol |
| LOGO | BRAND NAME |
|---|---|
 | Broncovit |
 | Ferrous Ascorbate + Folic Acid |
 | Neurospecial |
 | Cynomycin |
 | Tygacil |
 | Wymox |
 | Zosyn |
 | Loette |
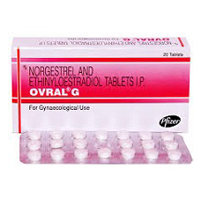 | Ovral G |
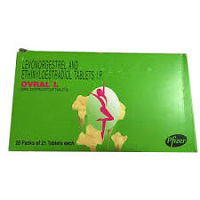 | Ovral L |
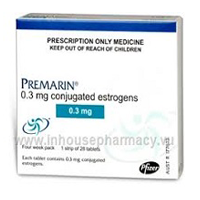 | Premarin 0.3 mg tablets |
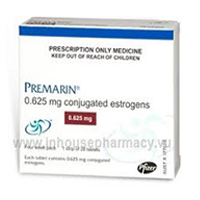 | Premarin 0.625 mg tablets |
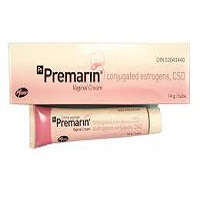 | Premarin Vaginal Cream |
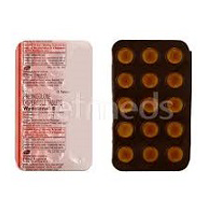 | Wysolone |
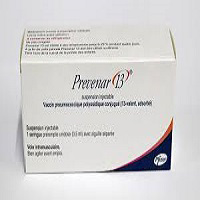 | Prevenar 13 |
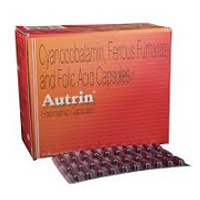 | Autrin Capsules |
 | Folvite Tablets |
 | Ativan |
 | Pacitane |
 | Enbrel |
 | Diamox Tablets |
 | Hetrazan |
 | Anacin |
 | Anne French |
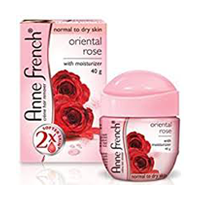 | A.F.H.R. CR.25GM-ORIENTAL ROSE |
 | BRONCOREX EXPECTORANT 50ML X1 BTL |
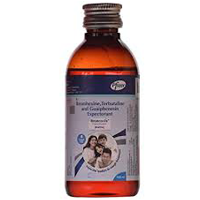 | BRONCOREXEXPECTORANT 100ML X1 BTL |
 | CARDIOVIT PLUS TABS 1X15 SP |
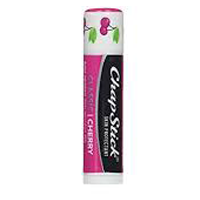 | CHAPSTICK CLASSIC CHERRY |
| LOGO | BRAND NAME |
|---|---|
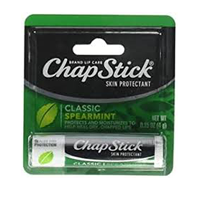 | CHAPSTICK CLASSIC SPEARMINT |
 | CHAPSTICK CLASSIC STRAWBERRY |
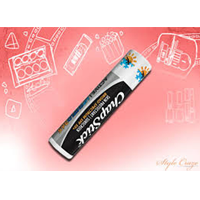 | CHAPSTICK LIPSHIELD 365 |
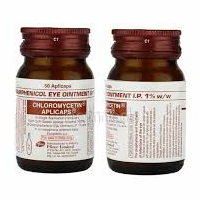 | CHLOROMYCETIN APPLICAPS 250MG 1X50 |
 | CHLOROMYCETIN EAR DROPS 5ML X1 BTL |
 | CITRALKA 1.53GM NLSLIQ 1X200 ML BOT IN |
 | CITRALKA LIQUID 100ML X1 BTL |
 | DORIS TABLETS 21s |
 | FUMYCIN 150MG CAPS 1X1 SP |
 | LEDERCORT 4MG TABS 1X15 SP |
 | MERONEM 1G 30ML 1X1 VL IN |
 | MERONEM 500MG 20ML 1X1 VL IN |
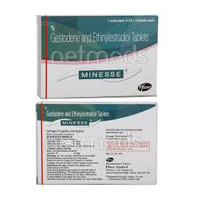 | MINESSE TABS 1X28 SP |
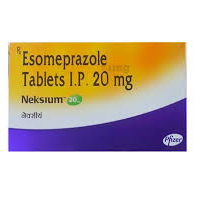 | NEKSIUM 20MG TAB 1X10 |
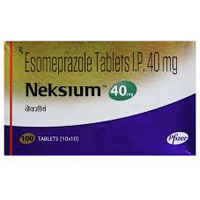 | NEKSIUM 40MG |
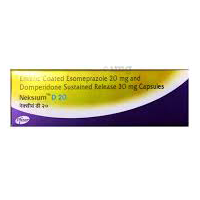 | NEKSIUM D 20/30mg Cap BLST IN |
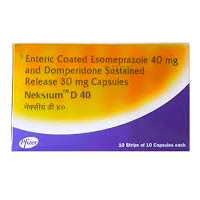 | NEKSIUM D 40/30mg Cap BLST IN |
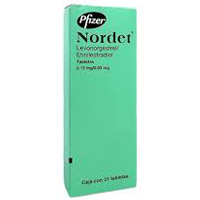 | NORDETTE 28 |
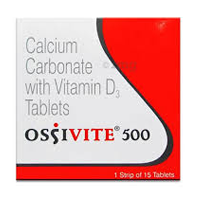 | OSSIVITE 500MG TABS 1X15 SP |
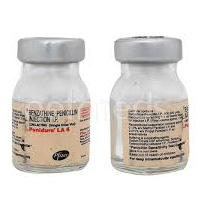 | PENIDURE LA 06 INJ X1 VL |
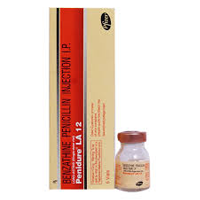 | PENIDURE LA 12 INJ X1 VL |
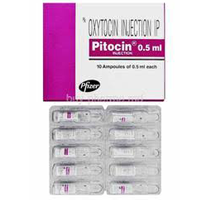 | PITOCIN 0.5ML INJ X1 AM |
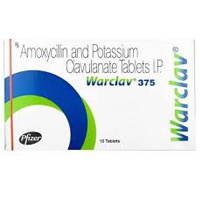 | WARCLAV 375MG TABS 1X10 SP |
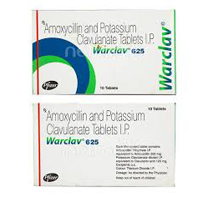 | WARCLAV 625MG TABS 1X10 SP |
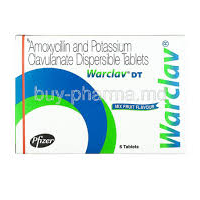 | WARCLAV DT TABS 1X10 SP |
 | WYTROL CAP 1x15 BLST IN |
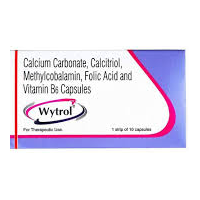 | WYTROL CAPS 1X10 SP |
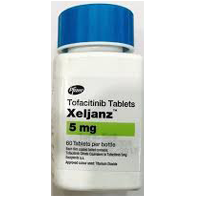 | XELJANZ 5mg TAB 1x60 BTL IN |
Website: www.pfizerindia.com
About the company - Business Profile
Pfizer Limited is a leading pharmaceutical company in India, operating as a subsidiary of the global biopharmaceutical giant Pfizer Inc. The company focuses on the discovery, development, and manufacturing of healthcare products, primarily in the areas of vaccines, oncology, internal medicine, and inflammation & immunology. With a history spanning over seven decades in the Indian market, Pfizer Limited maintains a significant presence through its diverse therapeutic portfolio and commitment to patient care.
Key Points
- Key Facts: Pfizer Limited was incorporated in 1950 and is headquartered in Mumbai, Maharashtra. It is a subsidiary of Pfizer Inc., USA, which indirectly holds a 63.92% stake in the company. The company is listed on both the BSE and NSE.
- Operations and Resources: As of March 31, 2025, the company reported fixed assets of ₹731 crore and maintained cash and bank balances of ₹2,801 crore. The company operates through a network of distributors, stockists, and healthcare professionals across India.
- Market and Significance: Pfizer Limited serves a wide range of customers, including patients, healthcare professionals, hospitals, and government institutions. It holds a significant position in the Indian pharmaceutical market, particularly in critical therapy areas like vaccines and oncology.
- Sustainability and Innovation: The company has implemented an Effluent Treatment Plant Sludge De-Watering System to reduce hazardous waste. In logistics, it has transitioned certain routes from air to ocean to reduce its carbon footprint. Pfizer has committed to reaching net-zero emissions by 2040 through collaboration with its Logistics Service Providers.
- Business Model: Pfizer Limited's business model is centered on providing science-based healthcare solutions. It excels in navigating complex regulatory environments and maintaining high standards of pharmaceutical marketing practices, recently declaring full adherence to the Uniform Code for Pharmaceutical Marketing Practices (UCPMP) 2024.
- Revenue and Financials (FY 2024-25):
- Net Sales: ₹2,128 crore (compared to ₹2,081 crore in FY 2023-24).
- Profit After Tax (PAT): ₹768 crore.
- Geographical Revenue: Domestic sales form the vast majority of turnover, with exports contributing 5% to the total turnover, reaching countries including Nepal, Sri Lanka, Bangladesh, Ireland, and the Netherlands.
- Dividend: For FY 2024-25, the Board recommended a final dividend of ₹35 per share and a special dividend of ₹100 per share to commemorate its 75th year in India.
- Product Highlights: The company's portfolio includes well-established brands in internal medicine, vaccines, and oncology. Recent focus has been on strengthening its "Power Brands" and expanding its reach in the Indian market.
- Workforce: As of March 31, 2025, Pfizer Limited employed 1,733 total employees, consisting of 1,563 permanent employees and 170 non-permanent staff. The workforce is comprised of 81% male and 19% female employees.
- Subsidiaries: The company does not have any subsidiaries, associate companies, or joint ventures as of the latest reporting period.
- Strategic Initiatives: Current focus includes enhancing digital engagement with healthcare professionals, optimizing the supply chain for sustainability, and driving growth in core therapeutic areas. The company celebrated its 75th year of operations in India in 2025.