Nifty 50 Share Price Today and Live Chart - PE Ratio, PB, EPS, Dividend yield, ETFs, Performance, FnO
Nifty 50 Index
- Nippon India ETF Nifty 50 BeESNIFTYBEES262.89001.01 (0.39%)
- Quantum Nifty 50 ETFQNIFTY254.21001.02 (0.40%)
- Kotak Nifty 50 ETFNIFTY1255.47000.75 (0.29%)
Nifty 50 Performance: Nifty 50 Index Today, Week, Month, Year Change
Nifty 50 index today and over the week, month and year


- < -5%
- -2 to -5%
- 0 to -2%
- 0 to 2%
- 2 to 5%
- > 5%
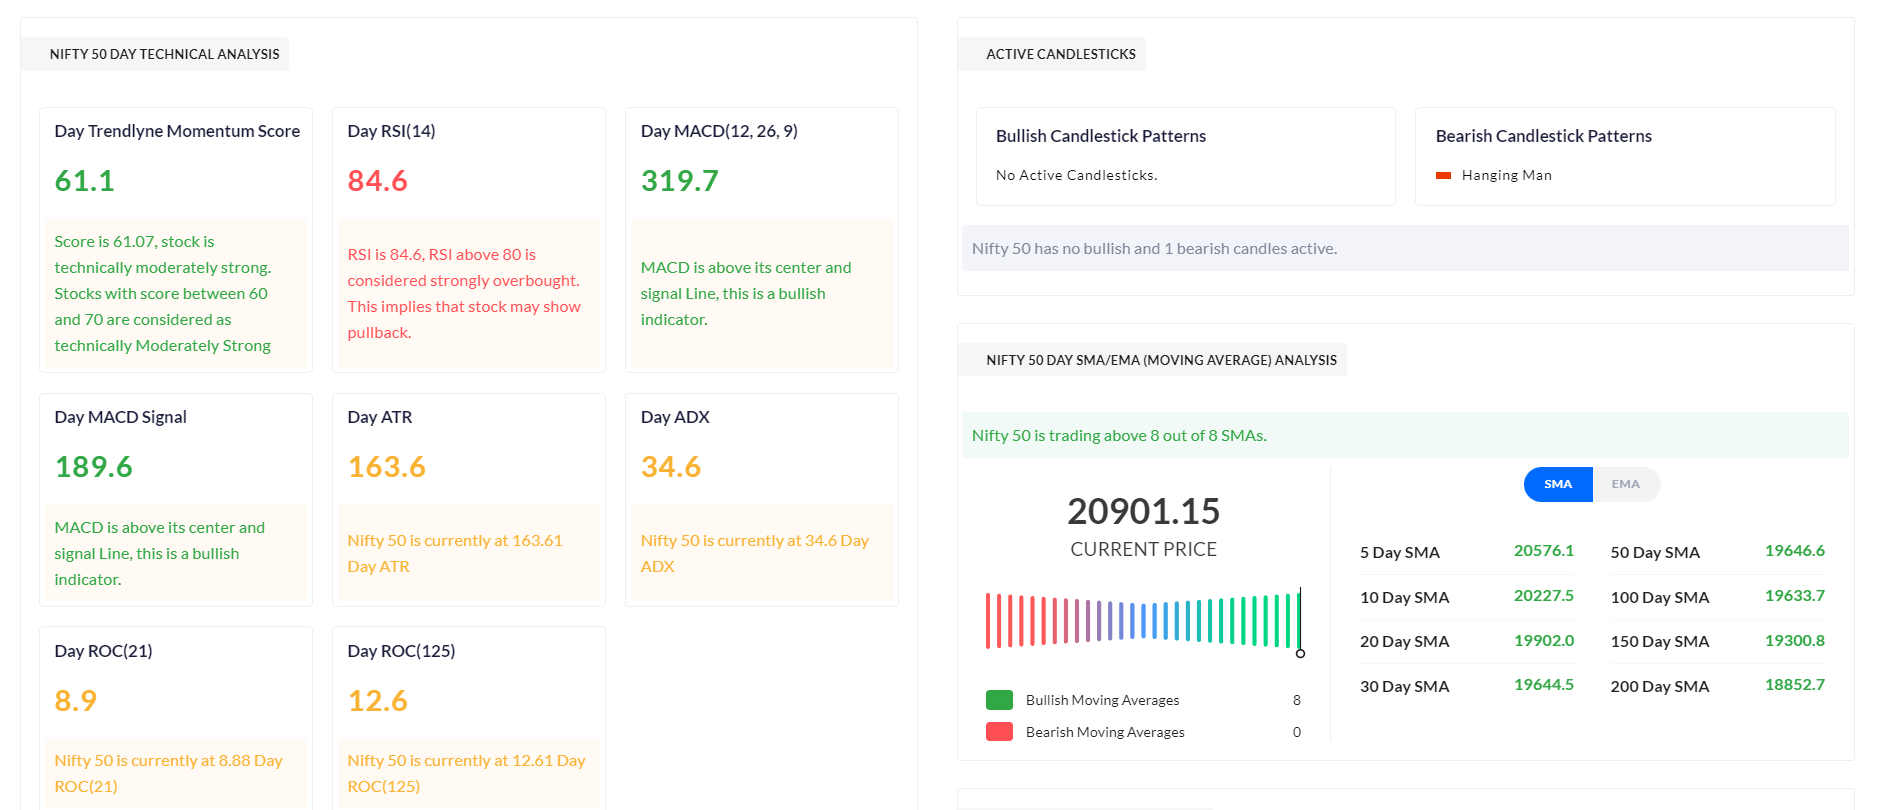
Technical Analysis
Nifty 50 EMA & SMA
| 5 Day | 22882.6 |
|---|---|
| 10 Day | 22825.9 |
| 12 Day | 22818.4 |
| 20 Day | 22845.8 |
| 26 Day | 22902.0 |
|---|---|
| 50 Day | 23159.6 |
| 100 Day | 23514.6 |
| 200 Day | 23909.3 |
Nifty 50 Active Candlesticks
Nifty 50 Resistance and Support
| First Resistance | 23145.8 |
|---|---|
| Second Resistance | 23238.4 |
| Third Resistance | 23358.8 |
| First Support | 22932.8 |
|---|---|
| Second Support | 22812.4 |
| Third Support | 22719.8 |
| Day RSI | 53.5 |
|---|---|
| Day MACD | -83.6 |
| Day MFI | - |
| Day MACD Signal Line | -153.6 |
Nifty 50 Price Change Analysis
Nifty 50 stocks list: Nifty 50 companies analysis
Nifty 50 share price for index companies, and analysis
| Stock Name | 3M Price Chart | Market Cap | LTP Last Traded Price | Day High Low (%) | Week High Low (%) | Month High Low (%) | Qtr High Low (%) | 1 Year High Low (%) | 3 Year High Low (%) | 5 Year High Low (%) | 10 Year High Low (%) |
|---|---|---|---|---|---|---|---|---|---|---|---|
| Reliance Industries | 1,576,405.4 | 1,164.9 | L -0.2%H 1152.51174.6 | L -2.1%H 1152.51204.5 | L -1.5%H 1152.21234.3 | L -9.9%H 1152.21337 | L -21.7%H 1152.21611.8 | L 0.7%H 1114.91611.8 | L -8.1%H 10901611.8 | L 347.5%H 230.31611.8 | |
| Bharti Airtel | 1,202,685.9 | 1,973.7 | L 0.1%H 19581985 | L 4.3%H 1874.51985 | L 11.4%H 1726.31985 | L 0.9%H 1726.32031 | L -4.5%H 1726.32174.5 | L 113.1%H 895.52174.5 | L 188.0%H 628.82174.5 | L 519.3%H 276.92174.5 | |
| HDFC Bank | 1,068,833.5 | 692.8 | L 1.4%H 680.9695.5 | LH 669.2695.5 | L -4.1%H 669.2734.9 | L -8.1%H 669.2757.6 | L -30.6%H 669.21017.5 | L -6.7%H 669.21020.5 | L -12.5%H 635.81020.5 | L 121.1%H 289.51020.5 | |
| ICICI Bank | 1,003,900.9 | 1,398 | L 0.8%H 1383.31404.9 | L 0.3%H 1361.41404.9 | L 8.2%H 1295.31411.8 | L -2.5%H 12911460 | L 2.6%H 1187.61480 | L 51.2%H 909.31500 | L 74.3%H 642.21500 | L 455.1%H 222.71500 | |
| TCS | 905,462.6 | 2,502.6 | L 1.0%H 2494.22527.7 | L -1.1%H 2408.22549.7 | L 23.1%H 2045.12625 | L 2.9%H 2032.42625 | L -17.6%H 1976.83350 | L -25.9%H 1976.84592.3 | L -26.3%H 1976.84592.3 | L 109.3%H 1026.04592.3 | |
| SBI | 887,847.0 | 961.9 | L -1.0%H 959.6971.9 | L 0.3%H 943.4971.9 | L -0.3%H 937.5983.8 | L -6.2%H 937.51124.5 | L 2.9%H 930.31234.7 | L 70.2%H 555.21234.7 | L 91.5%H 4251234.7 | L 273.4%H 149.51234.7 | |
| Bajaj Finance | 584,679.4 | 939.1 | L 0.0%H 931.2952.5 | L 1.1%H 899.2952.5 | L -3.6%H 899.2995.8 | L -10.9%H 899.21176.4 | L -10.8%H 787.91176.4 | L 25.2%H 618.81176.4 | L 26.9%H 5221176.4 | L 769.2%H 76.11176.4 | |
| L&T | 544,733.6 | 3,871.7 | L 0.9%H 3806.23872.7 | L 6.2%H 3615.13894 | L 3.3%H 3592.93894 | L -1.7%H 3592.94125.3 | L -2.9%H 3288.14440 | L 32.3%H 2871.14440 | L 119.2%H 1456.44440 | L 293.7%H 6614440 | |
| Infosys | 480,907.6 | 1,185 | L 3.4%H 1147.91185 | L 2.7%H 1103.41185 | L 16.7%H 990.11197.8 | L 2.6%H 980.41197.8 | L -20.7%H 980.41728 | L -13.9%H 980.42006.5 | L -28.9%H 980.42006.5 | L 136.5%H 4302006.5 | |
| Kotak Mahindra Bank | 459,194.2 | 461.6 | L 0.6%H 457.1462.9 | L 7.2%H 437.6462.9 | L 13.7%H 406.0462.9 | L 18.5%H 386.5462.9 | L 8.0%H 345.5462.9 | L 34.4%H 308.8462.9 | L 13.6%H 308.8462.9 | L 181.6%H 138.5462.9 | |
| Hindustan Unilever | 438,104.8 | 1,864.6 | L 0.3%H 1840.41865.5 | L 2.8%H 1758.21878.6 | L 0.0%H 1758.21926.8 | L -11.5%H 1758.22138 | L -24.5%H 1758.22488 | L -24.8%H 1758.23035 | L -22.1%H 1758.23035 | L 122.2%H 782.03035 | |
| Sun Pharmaceutical | 426,529.8 | 1,777.7 | L 1.0%H 1766.21855 | L 1.7%H 1726.21855 | L -4.7%H 1719.11863.6 | L -11.2%H 1719.12046.9 | L 4.4%H 1583.72046.9 | L 59.4%H 1068.42046.9 | L 123.6%H 733.72046.9 | L 137.6%H 3122046.9 | |
| Adani Ports | 399,625.7 | 1,850 | L -1.2%H 1813.71871.6 | L 8.7%H 16881872 | L 1.5%H 1674.21872 | L 11.2%H 1593.11872 | L 26.9%H 12921891.1 | L 135.7%H 767.21891.1 | L 167.0%H 395.11891.1 | L 506.0%H 2031891.1 | |
| Titan Company | 393,866.3 | 4,436.5 | L 0.1%H 4391.34486 | L 3.2%H 4240.84486 | L -5.1%H 42094698 | L -8.5%H 42095186.7 | L 18.3%H 3667.35186.7 | L 42.4%H 29255186.7 | L 86.1%H 1825.15186.7 | L 1060.6%H 296.25186.7 | |
| HCL Technologies | 387,538.5 | 1,428.1 | L 1.7%H 14101452 | L 0.4%H 13641452 | L 16.9%H 1172.81467.5 | L 5.6%H 1172.81467.5 | L -7.9%H 10301780.1 | L 12.9%H 10302012.2 | L 24.9%H 877.42012.2 | L 272.0%H 3682012.2 | |
| Axis Bank | 378,983.4 | 1,217 | L -0.7%H 1209.21227.7 | L 0.0%H 12001229.2 | L 0.4%H 1196.91293.8 | L -1.0%H 11751300 | L -1.7%H 1150.31418.3 | L 23.0%H 933.51418.3 | L 64.0%H 618.31418.3 | L 149.5%H 2861418.3 | |
| Maruti Suzuki | 358,324.6 | 11,397 | L -0.3%H 1134211473 | L 1.5%H 1110211616 | L -4.0%H 1098512065 | L -19.7%H 1098514440 | L -29.7%H 1098517370 | L 9.6%H 9737.717370 | L 52.3%H 6536.617370 | L 93.3%H 4001.117370 | |
| Mahindra & Mahindra | 353,199.5 | 2,840.3 | L -1.7%H 28392905.4 | L -0.7%H 2816.42912.9 | L -3.7%H 2744.32986 | L -13.5%H 2744.33534.6 | L -18.9%H 2744.33839.9 | L 89.6%H 14503839.9 | L 221.2%H 671.23839.9 | L 331.3%H 245.43839.9 | |
| Adani Enterprises | 349,098.9 | 2,579.4 | L -1.1%H 25572609.5 | L 4.1%H 2430.72628.6 | L -13.2%H 2430.72957.6 | L -15.4%H 2430.73173.7 | L 5.3%H 17533245 | L 15.7%H 17533629.7 | L 86.9%H 986.44062.1 | L 3870.8%H 56.64062.1 | |
| ITC | 332,847.6 | 265.6 | L 0.2%H 262.7267.9 | L 3.0%H 252.8267.9 | L 0.2%H 252.8269.8 | L -6.8%H 252.8292.6 | L -36.6%H 252.8426.4 | L -38.3%H 252.8528.5 | L 19.0%H 207528.5 | L 9.9%H 134.6528.5 | |
| Eternal | 331,634.3 | 343.7 | L 1.7%H 335.2346.5 | L 8.3%H 313.7346.5 | L 4.8%H 301.8346.5 | L 10.6%H 300.1346.5 | L 4.3%H 212.6346.5 | L 219.1%H 103.3368.5 | L 161.2%H 40.6368.5 | L 352.2%H 40.6368.5 | |
| UltraTech Cement | 325,473.2 | 11,045 | L -1.2%H 1100411154 | L -0.1%H 1092811211 | L 2.0%H 1042611219 | L -6.8%H 1042612239 | L -8.4%H 1032513110 | L 31.5%H 8351.113110 | L 44.6%H 5157.113110 | L 178.6%H 291013110 | |
| NTPC | 306,657.1 | 316.3 | L 1.9%H 308.2318 | L 6.1%H 294.1318 | L -2.2%H 292.1324.3 | L -8.3%H 292.1350.9 | L -8.4%H 292.1414.4 | L 34.8%H 232.1448.5 | L 138.4%H 119.1448.5 | L 151.3%H 73.2448.5 | |
| JSW Steel | 304,703.6 | 1,246 | L -0.8%H 12451263.6 | L 5.1%H 1186.71266.5 | L -2.1%H 11581275.9 | L -2.0%H 11581351 | L 3.0%H 1073.21351 | L 69.6%H 7231351 | L 86.2%H 520.11351 | L 651.5%H 132.51351 | |
| Bajaj Auto | 289,280.2 | 10,350 | L -0.3%H 1030910530 | L 2.8%H 993710775 | L -4.3%H 963710953 | L -9.5%H 963712470 | L 16.0%H 860512470 | L 95.0%H 528512774 | L 179.2%H 3027.112774 | L 265.7%H 1788.712774 | |
| ONGC | 283,546.9 | 225.4 | L -0.2%H 224.4227.7 | L -0.9%H 223.1229.9 | L -2%H 218.5231.6 | L -6.7%H 218.5245 | L -11.5%H 218.5307.5 | L 19.4%H 184.2345 | L 51.2%H 119.9345 | L 16.9%H 50345 | |
| Bharat Electronics | 270,388.7 | 369.9 | L 0.0%H 363.5371.2 | L 2.2%H 356.2374.4 | L -4.6%H 354.6391 | L -3.9%H 354.6416.4 | L -9.8%H 354.6473.5 | L 180.3%H 130.8473.5 | L 436.5%H 62.3473.5 | L 911.5%H 18.7473.5 | |
| Bajaj Finserv | 266,907.7 | 1,667.6 | L 0.0%H 16581680 | L 0.8%H 1624.81680.5 | L -4.3%H 1624.81760.9 | L -12.7%H 1624.82118.5 | L -21.1%H 15972128.9 | L 6.8%H 1419.12195 | L -6.4%H 1072.72195 | L 388.1%H 2482195 | |
| Power Grid Corp | 246,466.0 | 265 | L 1.9%H 259.3267.3 | L 7.1%H 244.6267.3 | L 1.3%H 242.3267.3 | L -7.3%H 242.3294.1 | L -9.1%H 242.3325.0 | L 31.9%H 200.5366.3 | L 90.9%H 135.2366.3 | L 169.1%H 68.7366.3 | |
| Coal India | 239,730.1 | 389 | L -1.0%H 380.4398.1 | L -2.1%H 380.4405 | L -8.5%H 380.4432.9 | L -6.8%H 380.4436.3 | L 0.3%H 369.6491.3 | L 23.7%H 305.9543.6 | L 136.5%H 139.2543.6 | L 19.5%H 109.6543.6 | |
| Nestle | 225,034.3 | 1,167 | L -1.8%H 11651185 | L -0.7%H 1147.41188.6 | L -13.3%H 1147.41385.9 | L -23.3%H 1147.41553 | L -8.8%H 1147.41553 | L -3.4%H 10551553 | L 22.8%H 8001553 | L 236.3%H 282.81553 | |
| Asian Paints | 222,533.9 | 2,320 | L 0.8%H 2271.22348 | L 0.6%H 2217.12348 | L -3.9%H 2217.12430.5 | L -15.5%H 2217.12810 | L -8.1%H 21152985.7 | L -21.8%H 21153423.0 | L -25.2%H 21153590 | L 115.7%H 851.13590 | |
| Tata Steel | 209,224.0 | 167.6 | L -1.1%H 167.2168.7 | L 0.0%H 165.5172.5 | L -10.9%H 163.4189.6 | L -10.3%H 163.4193.7 | L -9.1%H 160.1224.4 | L 40.7%H 114.6224.4 | L 27.4%H 82.7224.4 | L 314.1%H 25.1224.4 | |
| Grasim Industries | 202,890.6 | 2,981.4 | L 1.7%H 2900.12981.4 | L 3.0%H 28582981.4 | L -3.8%H 2828.23112.3 | L -4.0%H 2828.23411.1 | L 1.1%H 2502.53411.1 | L 59.3%H 1854.03411.1 | L 73.9%H 1271.53411.1 | L 208.4%H 383.53411.1 | |
| Hindalco Industries | 198,812.1 | 884.7 | L -0.2%H 876.1892.5 | L 1.7%H 851.1901 | L -7.4%H 851.1956.8 | L -8.8%H 851.11088.0 | L 2.7%H 770.21176 | L 93.7%H 453.31176 | L 92.4%H 309.01176 | L 490.8%H 84.91176 | |
| Eicher Motors | 198,201.2 | 7,220 | L -0.3%H 71987343 | L 2.2%H 6931.57343 | L 0.6%H 6767.57438.5 | L -8.8%H 6767.58165 | L 4.8%H 64428230 | L 115.0%H 32758230 | L 190.6%H 2159.68230 | L 200.6%H 1245.08230 | |
| Shriram Finance | 193,694.3 | 823.2 | L -2.1%H 822841 | L -4.8%H 810.1843 | L -15.3%H 810.1990.6 | L -19.9%H 810.11153.7 | L 11.5%H 7271153.7 | L 117.5%H 374.11153.7 | L 186.6%H 200.41153.7 | L 289.2%H 85.71153.7 | |
| InterGlobe Aviation | 188,600.5 | 4,877.6 | L 4.3%H 4635.44877.6 | L 7.2%H 4485.14877.6 | L 0.1%H 4464.45069.5 | L -6.8%H 4464.45508 | L -14.8%H 3895.25970 | L 95.5%H 2414.86232.5 | L 124.2%H 1511.86232.5 | L 419.8%H 6916232.5 | |
| Tech Mahindra | 175,535.1 | 1,790.8 | L 1.2%H 1773.61813.4 | L 0.0%H 1733.21813.4 | L 18.6%H 1442.51845 | L 7.3%H 1442.51845 | L 24.9%H 1304.11854 | L 58.9%H 1113.81854 | L 21.2%H 943.71854 | L 307.3%H 356.71854 | |
| SBI Life Insurance | 166,425.4 | 1,658.6 | L 0.4%H 1645.81685.9 | L 1.1%H 1612.51692 | L -4.4%H 1607.71754.3 | L -11.7%H 1607.71915 | L -15.7%H 1607.72132 | L 25.1%H 1307.72132 | L 44.8%H 1003.52132 | L 136.9%H 4852132 | |
| Trent | 160,892.2 | 3,017.3 | L 5.4%H 29803060 | L 10.6%H 2690.33060 | L 14.5%H 2545.83060 | L 0.6%H 2545.83244.5 | L -4.6%H 2183.73399.7 | L 113.5%H 1412.75563.3 | L 351.2%H 647.15563.3 | L 2115.3%H 116.75563.3 | |
| BSE | 142,567.6 | 3,510.4 | L 0.2%H 3465.63525 | L 8.7%H 32133537.5 | L 9.7%H 30003537.5 | L -0.6%H 30003671.4 | L 43.7%H 2326.14446.8 | L 454.9%H 583.54446.8 | L 2285.9%H 135.44446.8 | L 3819.6%H 30.64446.8 | |
| Jio Financial | 135,034.2 | 204.5 | L -1.2%H 204.5207 | L -0.3%H 202.6208.8 | L -6%H 202.5221.4 | L -17.2%H 202.5268.2 | L -34.0%H 202.5316.9 | L -6.6%H 198.7394.7 | L -21.9%H 198.7394.7 | L -21.9%H 198.7394.7 | |
| Apollo Hospitals | 121,469.3 | 8,448 | L 3.0%H 81768448 | L 9.3%H 76348448 | L -2.4%H 74658659 | L -6.0%H 74659070.5 | L 8.5%H 6696.59070.5 | L 74.5%H 47909070.5 | L 98.2%H 3361.69070.5 | L 529.9%H 910.19070.5 | |
| HDFC Life Insurance | 114,039.2 | 524.9 | L 1.5%H 510.5525.8 | L 0.2%H 508.1525.8 | L 0.3%H 508.1565.9 | L -3.8%H 508.1567.4 | L -29.7%H 508.1788.5 | L -13.6%H 508.1820.8 | L -22.9%H 457.8820.8 | L 81%H 307820.8 | |
| Dr. Reddy's Labs | 112,848.2 | 1,352 | L 0.5%H 13451363.7 | L 10.0%H 12241363.7 | L 8%H 1167.21363.7 | L 18.1%H 11301363.7 | L 12.5%H 11011414.9 | L 26.5%H 10201421.5 | L 45.1%H 730.81421.5 | L 103.3%H 374.61421.5 | |
| Cipla | 111,399.7 | 1,378.9 | L 1.5%H 13571381.7 | L 3.1%H 13191381.7 | L 0.0%H 12921384 | L -6.0%H 12921488.1 | L -10.5%H 1165.71539.7 | L 15.5%H 1164.61702.1 | L 52.4%H 8501702.1 | L 138.3%H 355.31702.1 | |
| Tata Consumer | 101,533.2 | 1,025.9 | L 0.5%H 1002.41028.9 | L 6.4%H 9161028.9 | L 6.0%H 9161028.9 | L -6.2%H 9161110 | L -12.8%H 9161282.7 | L 16.2%H 881.11282.7 | L 28.3%H 642.21282.7 | L 645.1%H 112.91282.7 | |
| Tata Motors PV | 97,746.6 | 265.4 | L -0.2%H 263.1267.0 | L 0.3%H 259.1267 | L -5.5%H 259.1290.4 | L -20.6%H 259.1353.2 | L -35.7%H 259.1417.9 | L -57.8%H 259.11179 | L -45.1%H 259.11179 | L -50.1%H 63.51179 | |
| Max Healthcare | 83,704.7 | 860 | L 1.0%H 849.4883.0 | L 5.5%H 812.1883.0 | L -12.4%H 797976.3 | L -23.5%H 7971132 | L -27.0%H 7971185.4 | L 49.3%H 569.11314.3 | L 159.5%H 326.21314.3 | L 1151.8%H 97.21314.3 |
Nifty 50 FAQ
The NSE selects the stock list for the Nifty 50 based on criteria that includes NSE listing, 6-month listing history, derivative trading approval, free-float market cap, and trading volume over the past 6 months.
The Nifty 50 Index is a benchmark stock market index on India's National Stock Exchange {NSE}. It represents 50 of the largest and most liquid Indian companies across various sectors. This index is used to assess the performance of the Indian equity market, and is considered a key indicator of market performance by investors and analysts.
The Nifty index page can be accessed from the markets page. Here you will find both the Nifty 50 and the Sensex indices available as links.
You can also search for the index in the search box.
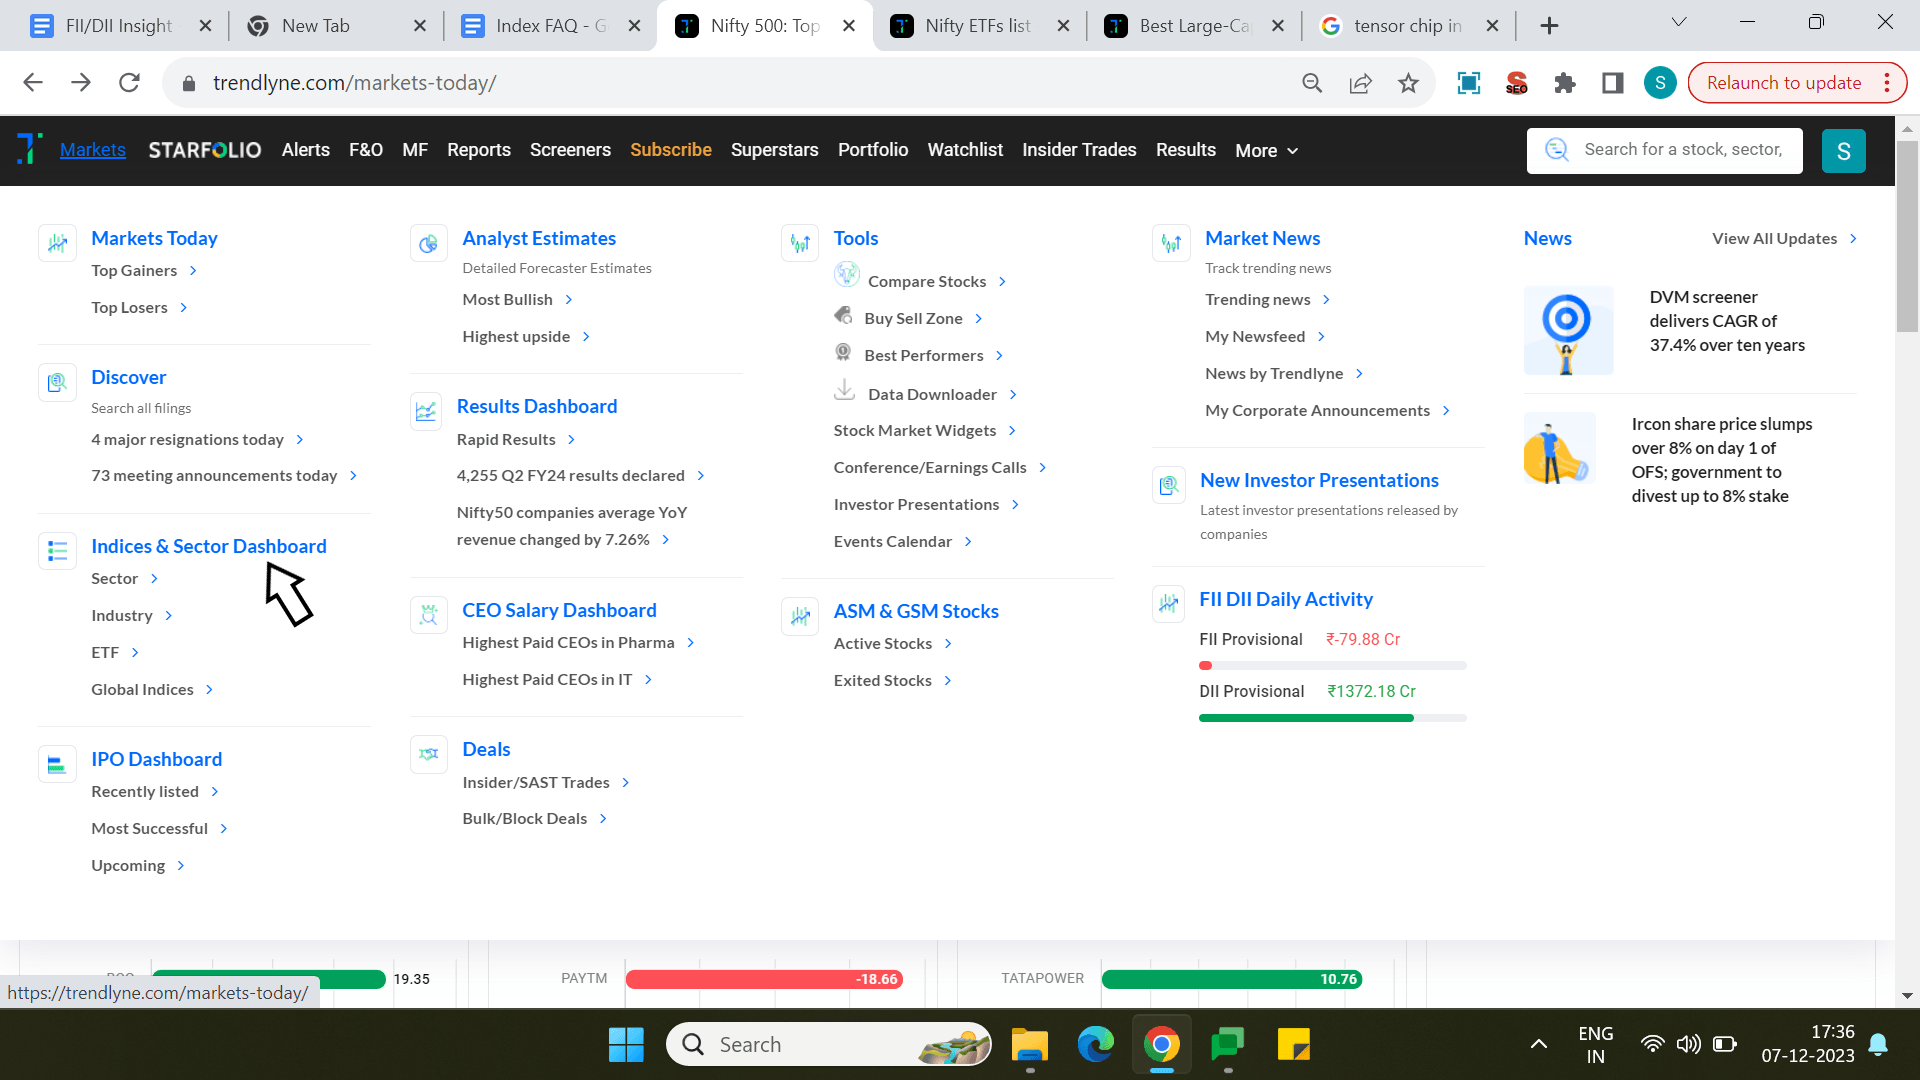
The index can also be accessed by hovering over the markets icon in the top left corner, and then clicking the indices and sector dashboard as pointed out by the arrow mark.
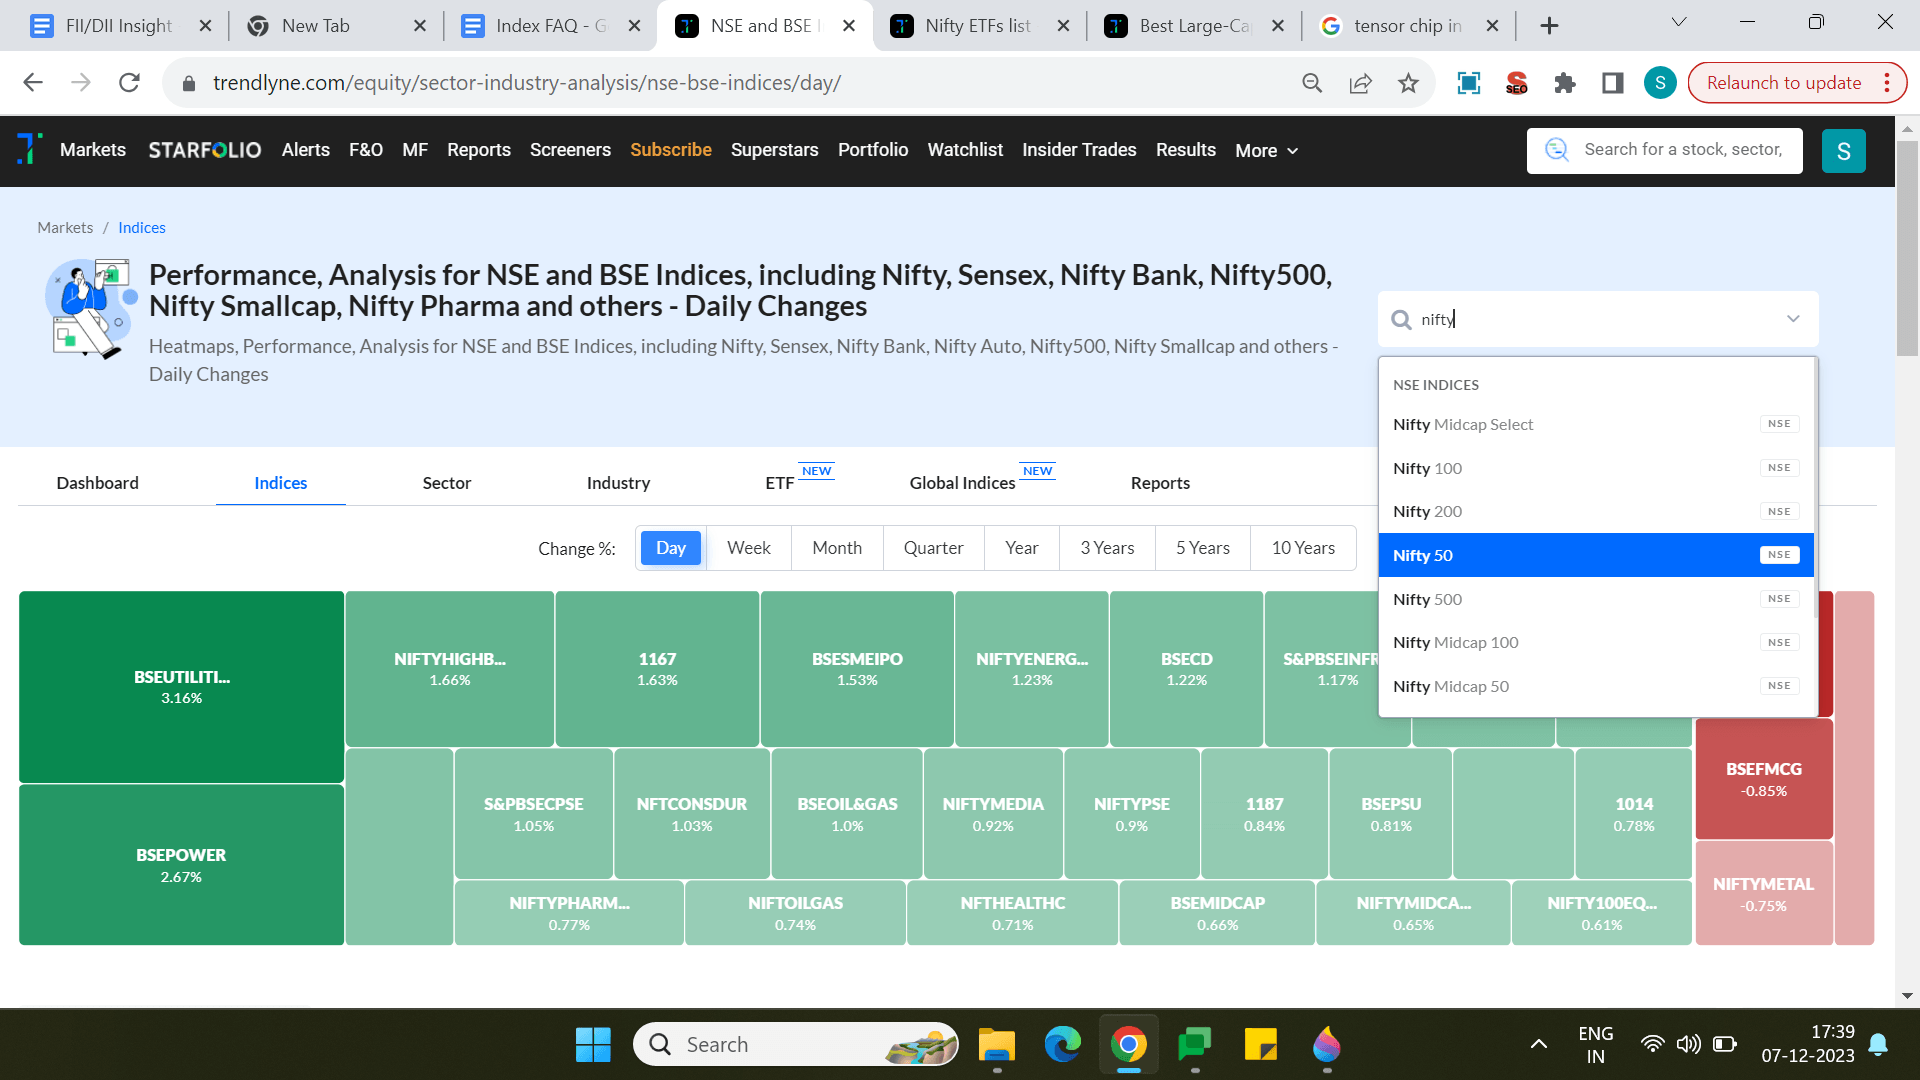
In the Indices and Sector Dashboard, use the search bar and search for “Nifty 50”, which will take you to the Nifty 50
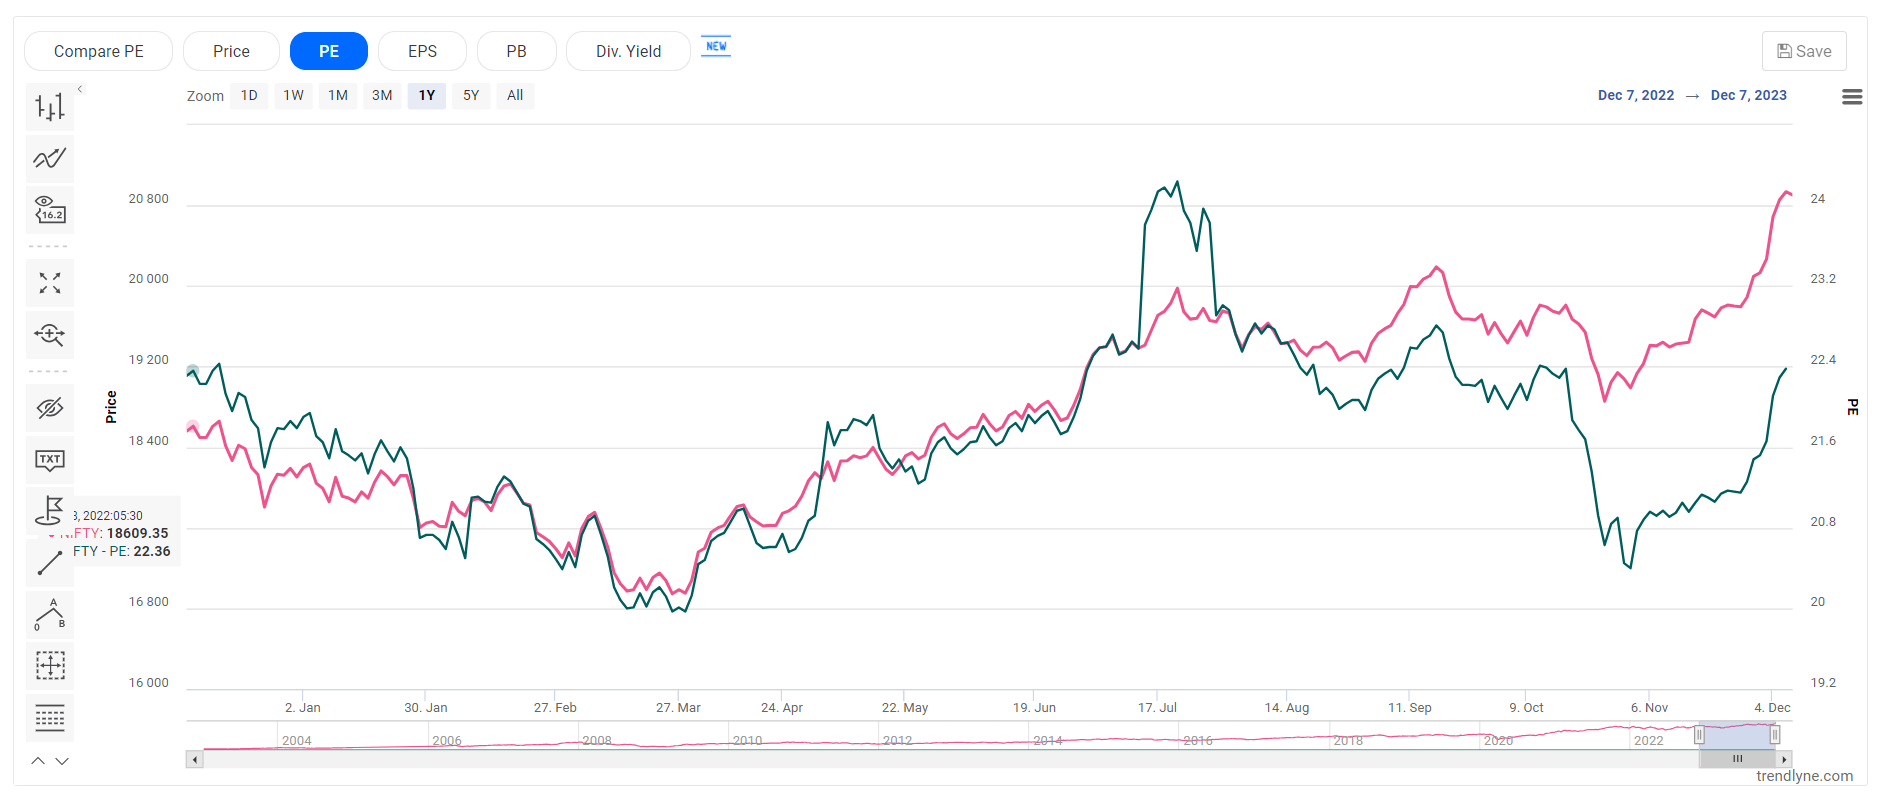
The Nifty 50 PE and Nifty 50 PB charts can be viewed in the index page overview section where one can select parameters for PE and PB. You can scroll down in the overview section to find these charts.
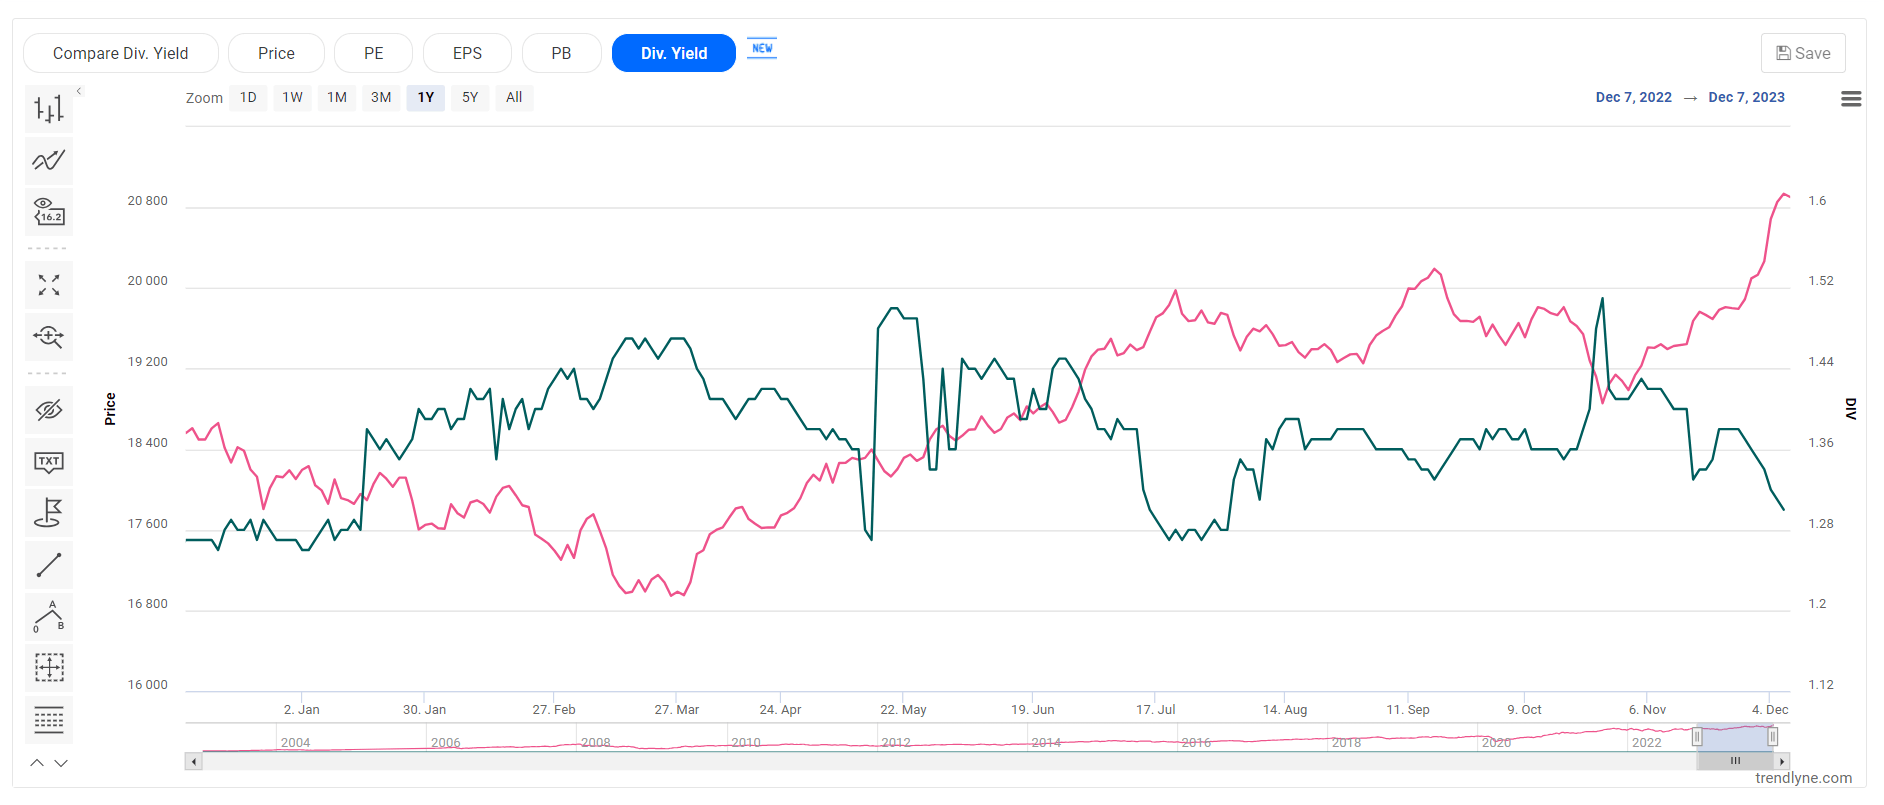
Nifty 50 undergoes rebalancing twice a year, usually in March and September. This process involves adjusting the index constituents based on criteria like market capitalization, liquidity, and sector representation. This ensures that the Nifty 50 remains a dependable indicator of the Indian stock market.
You can invest in the Nifty 50 Index through ETFs, Derivatives, or by buying shares of its constituent companies.
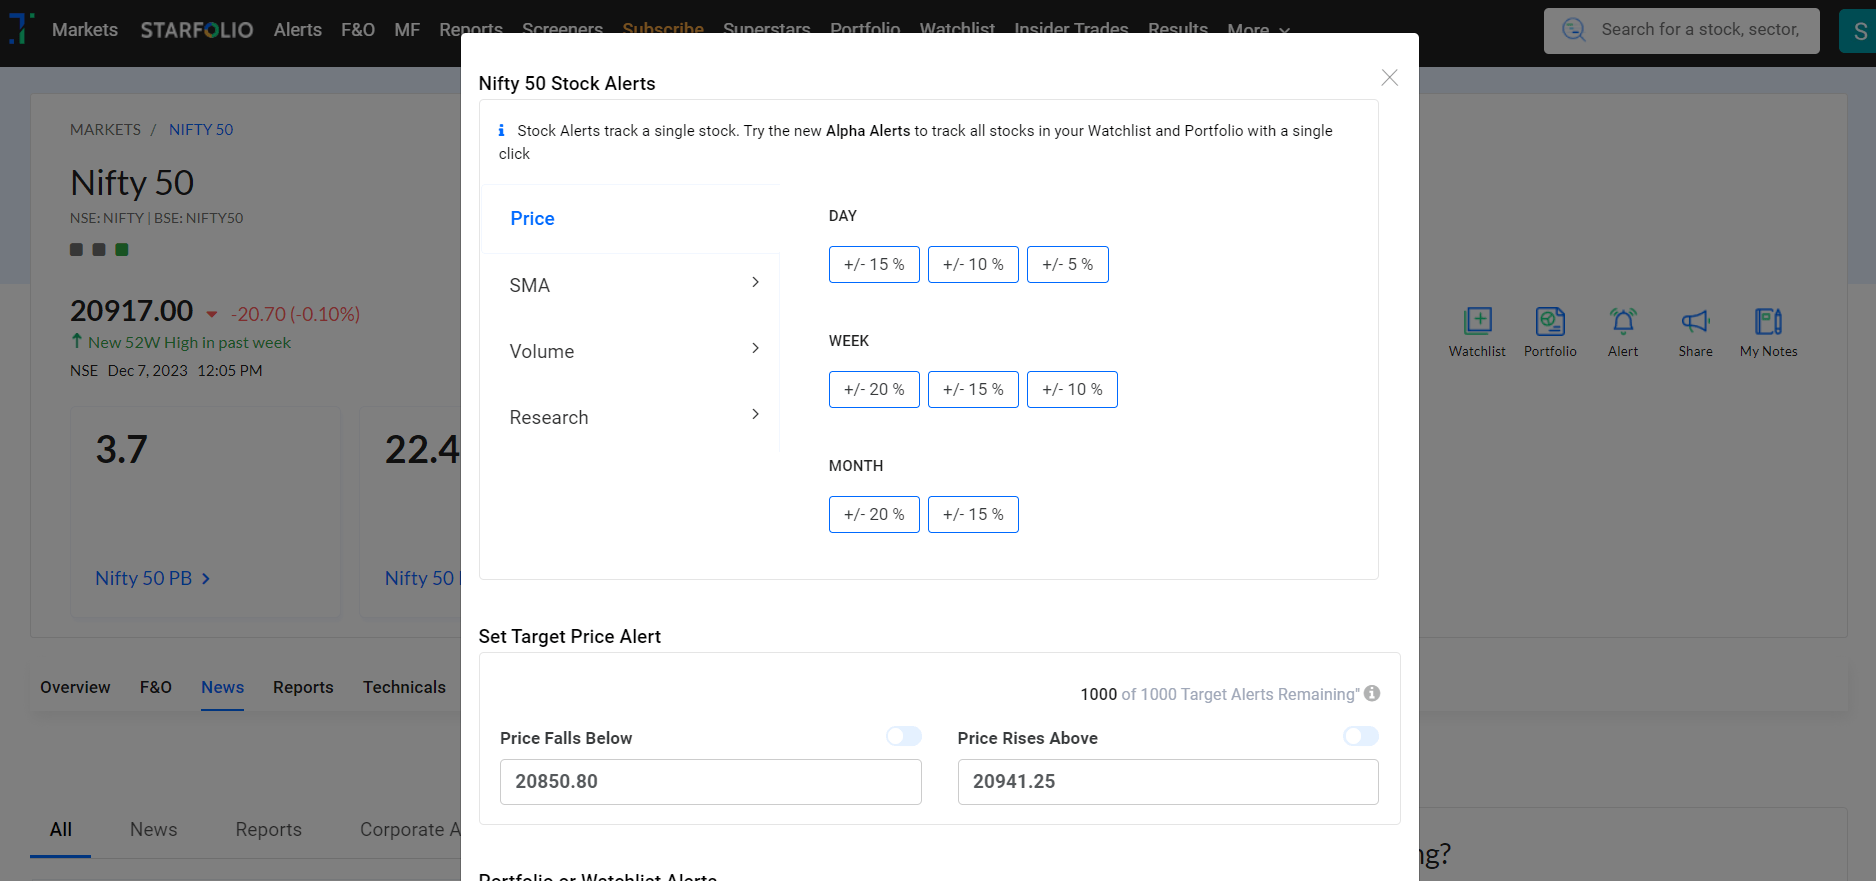
One can create alerts based on various parameters for when the index reaches the same. The parameters include price, SMA, Volume or when any new research report is published.
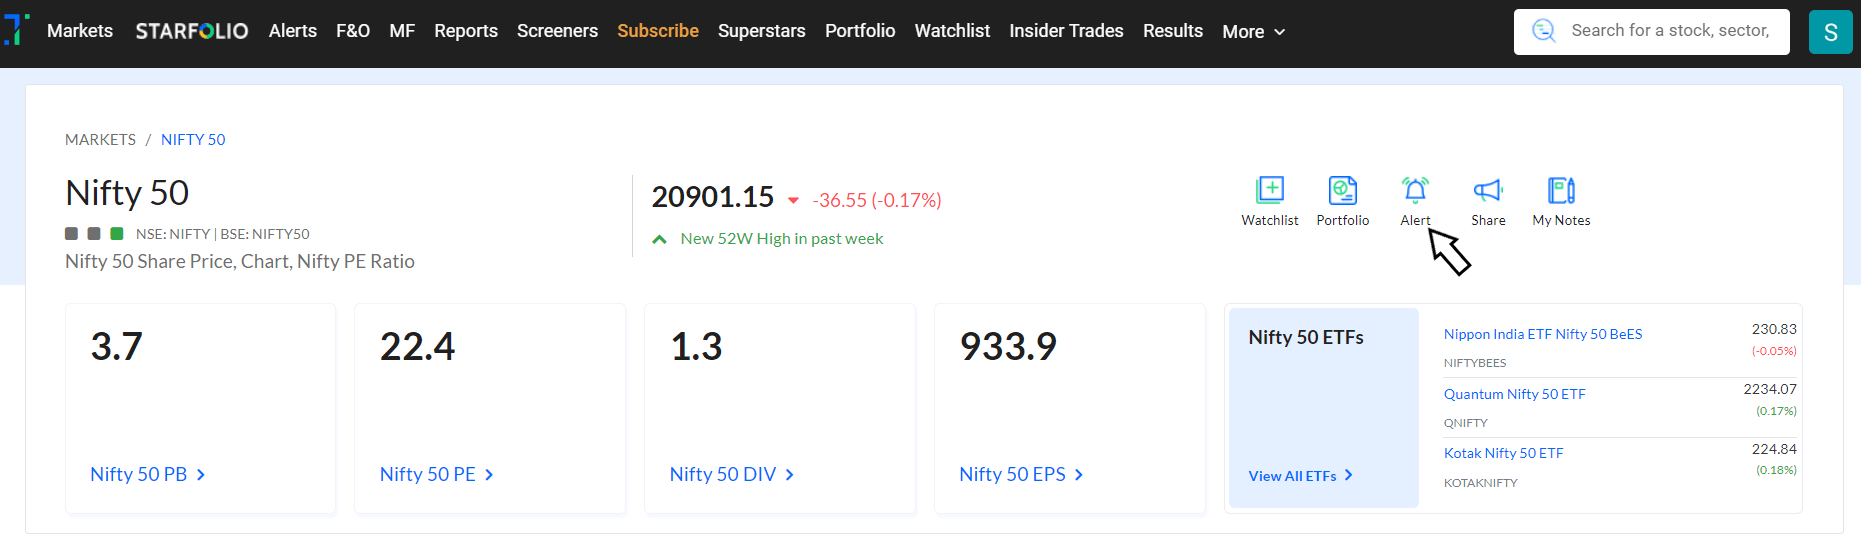
Click on the alert icon pointed by the arrow to set alpha alerts in the overview section.
You can find the index technicals under the Technicals section on the Nifty 50 page where you can find MACD, RSI, ADX, etc.